ABSTRACT
Background
This study is aimed to establish a novel and reliable UV-visible spectrophotometric method for simultaneous quantification of Adapalene and Erythromycin.
Purpose
There is no documented Ultra Violet analysis for these drugs together, especially in nanocarriers. This method is simple, rapid, selective, and precise, suitable for both bulk powders and drug-loaded nanocarriers.
Materials and Methods
A Shimadzu Ultra Violet/Visible spectrophotometer model 1800, was used. The optimized analysis condition employed Oxolane: Ortho phosphoric acid (OPA) buffer (30:70% v/v) as the solvent.
Results and Discussion
Erythromycin and Adapalene showed peak absorbance at 214 nm and 235 nm, respectively. The method exhibited a linear relationship between concentration and absorbance. Adapalene showed linearity between 0.1-0.5 μg/mL, and Erythromycin between 10-50 μg/mL. High regression coefficients (0.9985 for Adapalene, 0.9981 for Erythromycin) confirmed excellent quantification accuracy.
Conclusion
The results confirmed that the excipients present in the nanoformulation did not interfere with the analytical method, indicating its suitability for routine quality control analysis of Erythromycin and Adapalene in both bulk drug substances and formulated products.
INTRODUCTION
Acne vulgaris, a chronic skin condition, involves prolonged inflammation of the pilosebaceous unit, leading to both inflammatory and non-inflammatory lesions (Williamset al., 2012). Long-term treatment, often lasting years, can impact mental health, causing depression and low self-esteem. Acne ranks among the world’s ten most prevalent illnesses (Chilickaet al., 2023).
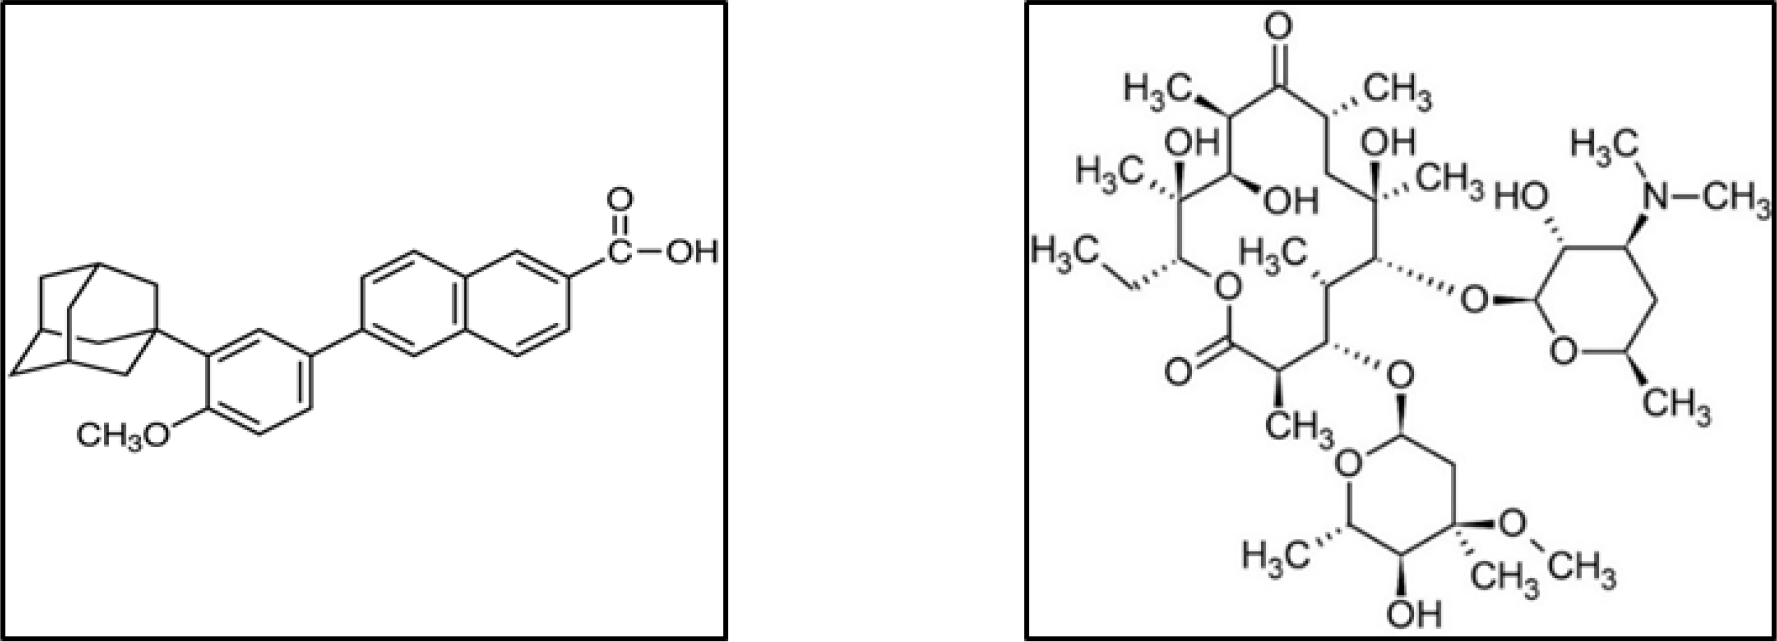
Adapalene (Figure 1A) is known by the chemical name 6-[3-(1-adamantyl)-4-methoxyphenyl]-2-naphthoic acid. The FDA has approved the topical retinoid adapalene to treat acne vulgaris. Retinoids are vitamin A derivatives that are usually expressed as generations with higher affinity for the Retinoic Acid Receptor (RAR) with later generations (Aroojet al., 2023). IUPAC name of Erythromycin (Figure 1B) is (3R,4S,5S,6R,7R,9R,11R,12R,13S,14R)-6-(((2S,3R,4S,6R)-4-(dimethylamino)-3-hydroxy-6-methyltetrahydro-2H-pyran-2-yl)oxy)-14-ethyl-7,12,13-trihydroxy-4(((2R,4R,5S,6S)-5-hydroxy-4-methoxy-4,6-dimethyltetrahydro-2H-pyran-2-yl)oxy)-3,5,7,9,11,13-hexamethyloxacyclotetradecane-2,10-dione. Erythromycin, a macrolide antibiotic discovered in 1952, treats both infectious and non-infectious diseases. As a bacteriostatic agent, it inhibits bacterial growth rather than killing bacteria. It works by binding to the 50S ribosomal subunit, blocking protein synthesis in susceptible microorganisms (Sayyafanet al., 2020).

Figure 1:
Chemical structure of A) Adapalene B) Erthromycin.
Combination therapy with Adapalene and Erythromycin targets multiple aspects of acne pathogenesis-inflammation and bacterial resistance-unlike monotherapy (Dabadeet al., 2011). Adapalene’s major side effects include scaling, pruritus, erythema, dryness, and a persistent burning sensation, known as the retinoid reaction (Waller and Sampson, 2018). The major drawback of topical Erythromycin’s main drawback is bacterial resistance, which combination therapy helps minimize (Platonet al., 2022). Cubosome-based formulations improve drug bioavailability and provide controlled release, reducing side effects. Cubosomes are non-toxic, inert, non-irritant, aesthetically pleasing, and cosmetically acceptable (Sivadasanet al., 2023).
For accurate standardization and quantification of APIs, excipients, degradation products, and finished formulations, a precise analytical method is essential (Sharmaet al., 2018). Several techniques exist for individual quantification of Erythromycin and Adapalene, including UV spectroscopy (Rattanapoltaveechaiet al., 2007), HPLC-MS (Royet al., 2015), RP-HPLC (Martinset al., 2011; Rathoreet al., 2010), HPTLC1 (Thummaret al., 2020; Tsuji and Robertson, 1971), GC (Rozetet al., 2007). However, no UV spectrophotometric method for simultaneous quantification of both drugs in bulk or combined formulations has been reported. This research aimed to develop and validate a simple, rapid, sensitive, accurate, and precise UV spectrophotometric method suitable for routine quality control analysis of Adapalene and Erythromycin.
MATERIALS AND METHODS
Materials
Empree Medicaments INDIA Pvt. Ltd., Belagavi supplied Erythromycin and Adapalene drug. Merk India Limited traded the HPLC grade Acetonitrile. This research work employed only pure chemicals and reagents, including analytical grade triethylamine and orthophosphoric acid. A Shimadzu UV/visible spectrophotometer (UV-Probe, model 1800) with automatic wavelength correction and 10 mm Quartz cuvettes was used. Sample weighing was done using a Systronic electronic analytical balance. All measuring equipment, including cylinders, volumetric flasks, and pipettes, were calibrated before use to ensure accuracy.
Method Development
The UV spectrophotometric method begins with selecting a solvent system and determining its maximum absorption wavelength (λmax). After a literature review, solubility studies for Adapalene and Erythromycin were conducted. Various trials in Methanol, Oxolane, Acetonitrile, and Ortho phosphoric acid led to the final mobile phase: Oxolane and OPA buffer (30:70% v/v). UV spectra of both analytes, individually and combined, were scanned within the 800-200 nm range.
Method Validation
Following ICH guidelines Q2A and Q2B, the analytical method was validated by assessing linearity, accuracy, precision, and ruggedness. These evaluations confirmed the optimized method’s suitability by verifying its constraints (Ferenczi-Fodoret al., 2001; Mishra and Mundada, 2021).
Preparation of Solvent system
Mobile phase
0.1 mL Orthophosphoric acid and 0.5 mL Triethylamine was dissolved in 100 mL distilled water to prepare OPA buffer. In 70 mL of prepared OPA buffer 30 mL of accurately measured Oxolane was dissolved.
Standard Stock Solution
The preparation of standard stock solutions involved the use of separate 10 mL volumetric flasks containing 10 mg of Erythromycin and Adapalene, which were weighed and mixed with Oxolane to produce 1000 µg/mL stock solution.
Working stock solutions
A 10 mL volumetric flask was used to dilute 0.1 mL of Adapalene and 1 mL of Erythromycin stock solutions, then filled to volume with the mobile phase. Additional concentrations (0.1-0.5 mL Adapalene, 1-5 mL Erythromycin) were pipetted into the same flasks and topped up with the mobile phase.
Selection of wavelength
10 µg/mL of respectively stock solution was examined in the range of 400-200 nm for Erythromycin and Adapalene using OPA buffer as blank solution.
Specificity and selectivity
By scanning both the mobile phase and drug solutions, UV spectra were obtained between 400-200 nm to assess the identity of an analyte among a mixture of similar components in a sample.
Linearity and range
The experiment analyzed absorbance in relation to Adapalene and Erythromycin concentrations. Drug mixtures (0.1-0.5 mL Adapalene, 1-5 mL Erythromycin) created various concentrations (1-5 µg/mL Adapalene, 10-15 µg/mL Erythromycin) and were scanned. This process was repeated three times to ensure consistency. Statistical regression assessed whether absorbance changes correlated with drug concentration (Sanchez, 2018).
Limit of Detection and Limit of Quantification
As per the ICH guidelines: LOD, also known as the Detection Limit (DL), can be computed as LOD=3.3σ/S, whereas the Quantitation Limit (QL), also known as the limit of quantification, is LOQ=10σ/S. S denotes the slope of this calibration curve, and σ represents the standard deviation of that response (Varachhiyaet al., 2019).
Precision
Ruggedness
Robustness
Accuracy (Recovery studies)
Solvent and standard stock solution stability
Formulation of Cubosomal Dispersion
Cubosomes were prepared using the Top-Down approach, where Glyceryl Monooleate (GMO) and Pluronic F-127/Poloxamer 407 were melted at 40ºC. Erythromycin and Adapalene were then incorporated, followed by mixing with melted Pluronic F-127. Warm water was added dropwise under constant stirring, and sonication ensured uniform dispersion. The entrapped drug was then estimated.
Characterization of Cubosomal Dispersion
The drug-loaded cubosomal dispersion was diluted with distilled water to obtain suitable concentrations for analysis. Dynamic Light Scattering (DLS) was performed using a Malvern Zetasizer to determine the Polydispersity Index (PDI) and zeta potential of the formulation. All measurements were conducted in triplicate to ensure reproducibility and reliability of the data.
Separation of Unentrapped Drug from Cubosomes
A 2.5 mL aliquot of drug-loaded cubosomal dispersion was centrifuged at 15,000 rpm for 30 min at 4ºC using a KUBOTA-7000 refrigerated centrifuge. After separation, 0.1 mL of the supernatant, containing free drug, was diluted to 10 mL with Milli-Q water. To remove residual cubosomal particles, the diluted supernatant was filtered through a Millex® PTFE syringe filter.
Quantification of Encapsulated Drug UV Spectrophotometrically
The filtered solution was analyzed spectrophotometrically at
214 nm for Adapalene and 235 nm for Erythromycin. A blank cubosomal dispersion served as the reference for background subtraction. Standard calibration curves determined the concentration of encapsulated drugs. Entrapment efficiency was calculated using the given formula:
RESULTS
Method Validation
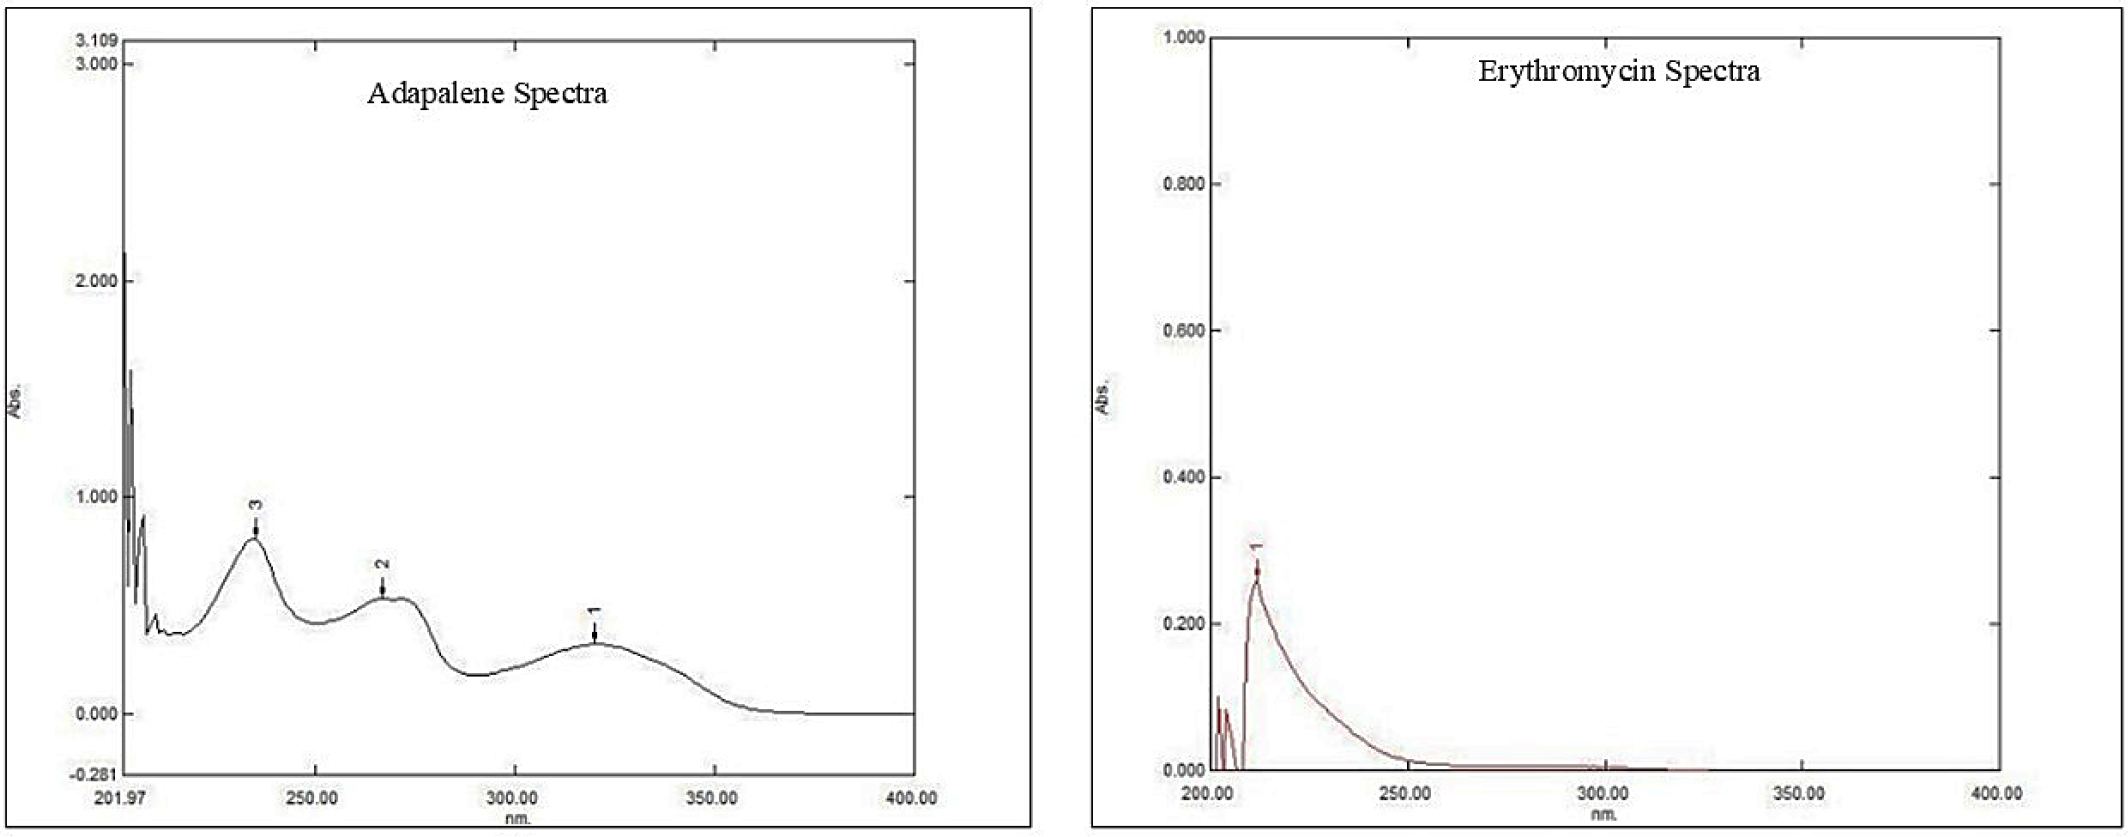
Adapalene and Erythromycin showed maximum absorption at 214 nm and 235 nm, and is represented in Figure 2 respectively.

Figure 2:
UV-Spectrum of Adapalene and Erythromycin.
Linearity
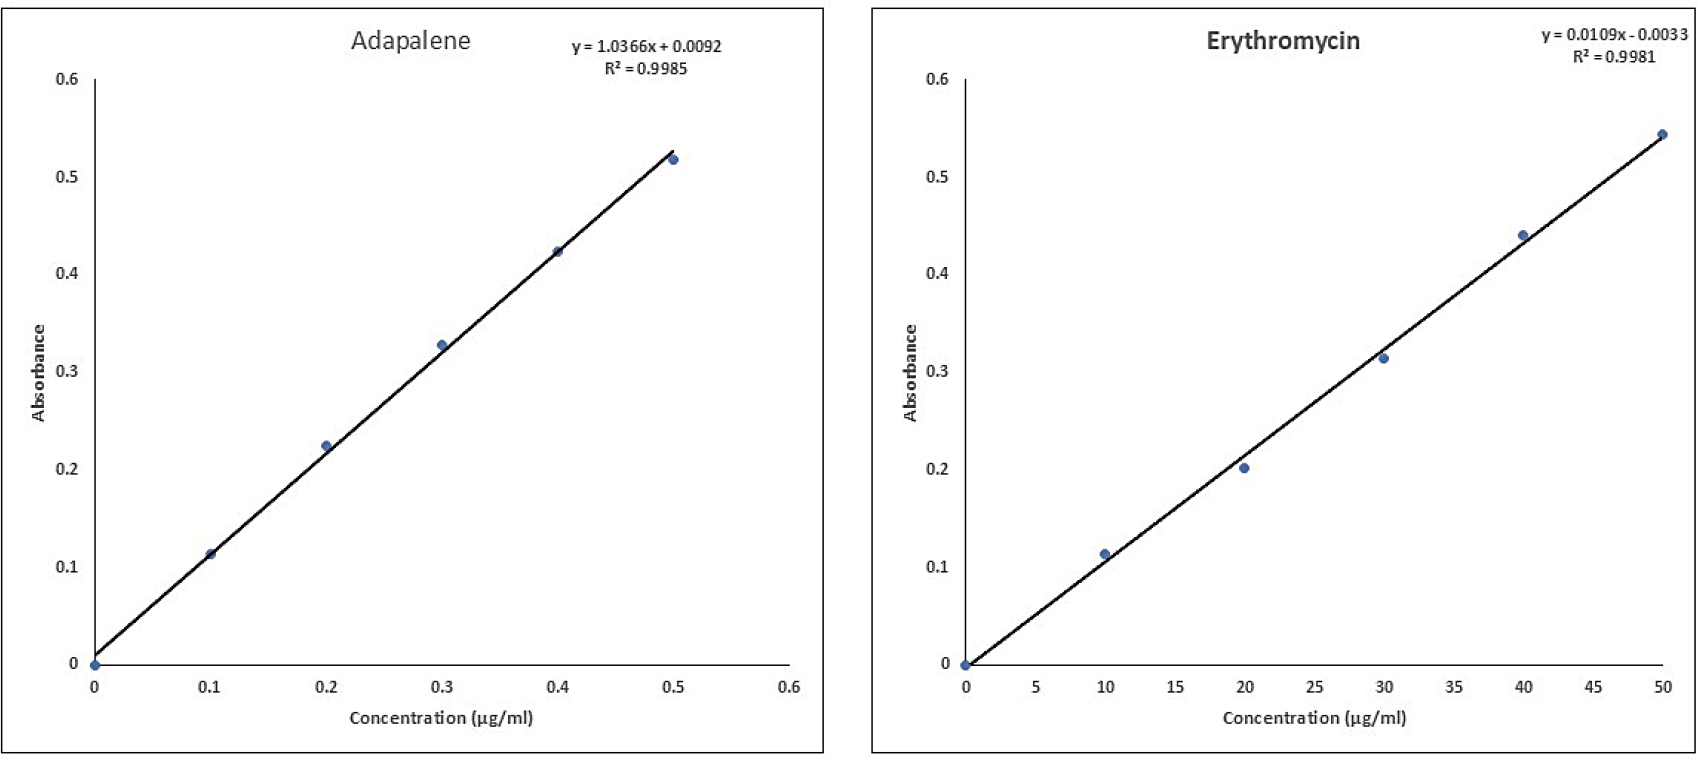
The experiment confirmed a linear relationship between drug concentration and absorbance for both Adapalene (ADP) and Erythromycin (ERY) with the of 0.1-0.5 μg/mL for ADP (Figure 3) and 10-50 μg/mL for ERY (Figure 3). This held true at both analyzed wavelengths (214 nm and 235 nm). Interestingly, the conclusion is further supported by the high correlation coefficients (R²) obtained: 0.9985 for ADP and 0.9981 for ERY.

Figure 3:
Standard Calibration Curve for Adapalene and Erythromycin.
LOD and LOQ
This research evaluated the analytical method’s sensitivity using Limit of Detection (LOD) and Limit of Quantitation (LOQ). LOD is the lowest detectable amount of a drug, while LOQ is the minimum concentration measurable with accuracy. The LOD for Erythromycin was 1.11 µg/mL and for Adapalene 0.02 µg/mL, while LOQ was 3.37 µg/mL for Erythromycin and 0.06 µg/mL for Adapalene.
Precision
The analysis method demonstrated good precision, as the percent Relative Standard Deviation (%RSD), calculated for three repeated measurements (replicates) at three different concentrations for both Adapalene and Erythromycin, consistently fell below 2%. Detailed results are presented in Tables 1 and 2.
| Concentration (µg/mL) | Erythromycin Absorbance (Avg.) | Erythromycin % RSD | Adapalene Absorbance (Avg.) | Adapalene % RSD |
|---|---|---|---|---|
| System Precision | ||||
| 10 | 0.193-0.194 | 0.298-0.299 | 0.122-0.123 | 0.471-0.472 |
| 30 | 0.347-0.348 | 0.166 | 0.205-0.206 | 0.280-0.281 |
| 50 | 0.518 | 0.223 | 0.291-0.292 | 0.198 |
| Intraday Precision (Morning, Afternoon, Evening) | ||||
| 10 | 0.193-0.194 | 0.298-0.299 | 0.122-0.123 | 0.471-0.472 |
| 30 | 0.347-0.348 | 0.166 | 0.205-0.206 | 0.280-0.281 |
| 50 | 0.518 | 0.223 | 0.291-0.292 | 0.198 |
| Concentration (µg/mL) | Erythromycin Absorbance (Avg.) | Erythromycin % RSD | Adapalene Absorbance (Avg.) | Adapalene % RSD |
|---|---|---|---|---|
| Day 1 | ||||
| 10 | 0.193 | 0.299 | 0.122 | 0.472 |
| 30 | 0.348 | 0.166 | 0.206 | 0.281 |
| 50 | 0.519 | 0.111 | 0.292 | 0.198 |
| Day 2 | ||||
| 10 | 0.194 | 0.298 | 0.123 | 0.471 |
| 30 | 0.347 | 0.166 | 0.206 | 0.281 |
| 50 | 0.518 | 0.111 | 0.291 | 0.198 |
| Day 3 | ||||
| 10 | 0.194 | 0.298 | 0.122 | 0.472 |
| 30 | 0.348 | 0.166 | 0.206 | 0.281 |
| 50 | 0.519 | 0.111 | 0.292 | 0.198 |
Ruggedness
Method’s Ruggedness was assessed by measuring the %RSD for Adapalene and Erythromycin under different analysts and instruments. The %RSD values remained below 2% for all replicates, indicating the method’s robustness and reproducibility. These findings are detailed in Table 3.
| Concentration (µg/mL) | Erythromycin Absorbance (Avg.) | Erythromycin % RSD | Adapalene Absorbance (Avg.) | Adapalene % RSD |
|---|---|---|---|---|
| Instrument Change | ||||
| 10 | 0.193 | 0.518 | 0.124 | 0.806 |
| 30 | 0.346 | 0.289 | 0.206 | 0.743 |
| 50 | 0.514 | 0.297 | 0.293 | 0.522 |
| Analyst Change | ||||
| 10 | 0.193 | 0.299 | 0.123 | 0.471 |
| 30 | 0.348 | 0.166 | 0.205 | 0.281 |
| 50 | 0.519 | 0.111 | 0.291 | 0.198 |
Robustness
To assess robustness, the analysis method underwent slight variations. The %RSD values calculated from the resulting data (regression coefficients) were all below 2%. These results, detailed in Table 4, demonstrate that the method remains unaffected by minor changes.
| Concentration (µg/mL) | Erythromycin Absorbance (nm) | Concentration (µg/mL) | Adapalene Absorbance (nm) | ||||
|---|---|---|---|---|---|---|---|
| 212 | 214 | 216 | 235 | 237 | 233 | ||
| 30 | 0.345 | 0.348 | 0.349 | 0.3 | 0.205 | 0.206 | 0.208 |
| 30 | 0.344 | 0.348 | 0.349 | 0.3 | 0.205 | 0.206 | 0.209 |
| 30 | 0.345 | 0.347 | 0.348 | 0.3 | 0.204 | 0.205 | 0.209 |
| Average | 0.345 | 0.348 | 0.349 | Average | 0.205 | 0.206 | 0.209 |
| %RSD | 0.168 | 0.166 | 0.166 | %RSD | 0.282 | 0.280 | 0.277 |
Accuracy (recovery studies)
Accuracy was tested by spiking samples and measuring recovery. Recoveries for Adapalene (98.98-100.23%) and Erythromycin (98.77-100.14%) were excellent.
Solvent and standard stock solution stability
To confirm that the working solutions remained stable and were not degraded in the diluent medium during the analysis, solution stability studies were performed. The %RSD values, derived from regression coefficients, were all found to be below 2%.
Characterization of Cubosomal Dispersion
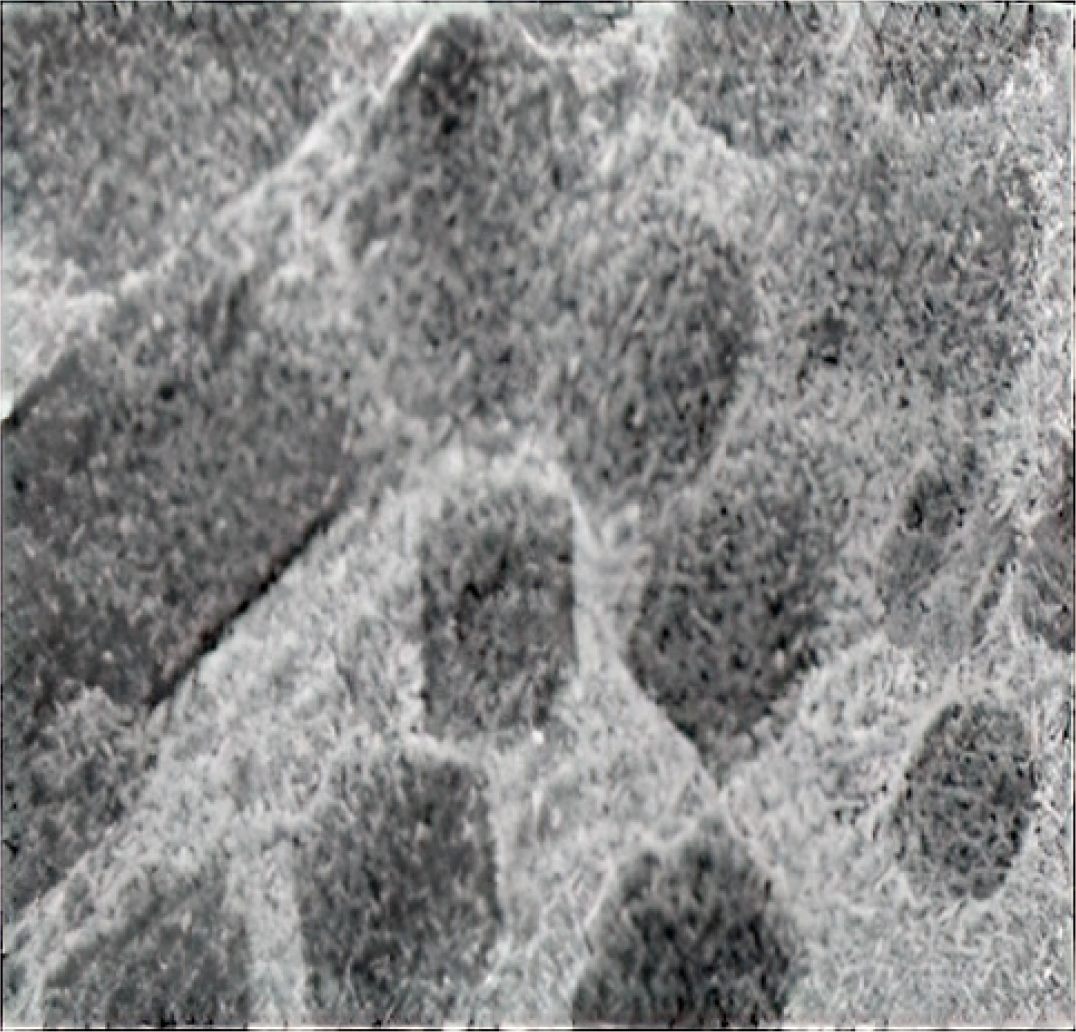
The particle size distribution, centered at 113.6 nm, is ideal for cubosomal formulations. A PDI of 0.489 indicates uniformity, while a zeta potential of -28.08 mV ensures colloidal stability by preventing aggregation. TEM imaging (Figure 4) confirms smooth, oval-shaped particles.

Figure 4:
TEM Analysis of Drug Loaded Cubosomal Dispersion.
Spectrophotometric Analysis of Cubosomes
Analysis of the final cubosome dispersion revealed high Entrapment Efficiencies (EE) of 85.2% and 86.2% for Erythromycin (ERY) and Adapalene (ADP), respectively. These values indicate successful encapsulation of a significant portion of both drugs within the cubosomes.
DISCUSSION
The drugs’ absorptivity remained stable within 0.1-0.5 μg/mL for Adapalene and 10-50 μg/mL for Erythromycin, confirming Beer-Lambert’s Law. High R² values (0.9985 for Adapalene, 0.9981 for Erythromycin) indicate strong linearity. LOQ exceeded LOD, highlighting the need for sensitivity and precision. Results were consistent across concentrations, demonstrating precision. The method showed ruggedness under slight lab variations. %RSD remained below 2%, confirming robustness and repeatability. The validation characteristics and results you described-such as linearity, precision, accuracy, robustness, ruggedness, LOD/LOQ, and compliance with Beer-Lambert’s Law-are directly aligned with internationally recognized regulatory guidelines for analytical method validation (ICH Harmonised Tripartite Guideline Validation of Analytical Procedures: Text and Methodology Q2(R1) Retrieved from the International Conference on Harmonisation of Technical Requirements for Registration of Pharmaceuticals for Human Use, 2014). Recovery studies demonstrated the method’s accuracy, with high recovery rates for Adapalene (98.98-100.23%) and Erythromycin (98.77-100.14%). Solution stability confirmed no degradation of working solutions, ensuring reliable results. Cubosomes showed high entrapment efficiency-85.2% for Erythromycin and 86.2% for Adapalene-demonstrating their potential for targeted drug delivery and efficient transport to specific sites (Boydet al., 2009).
CONCLUSION
The UV-Spectrophotometry method was designed and validated for detecting Erythromycin and Adapalene in bulk drugs and cubosomal dispersion. Detection wavelengths were set at 214 nm for Adapalene and 235 nm for Erythromycin, using Oxolane: OPA buffer (30:70% v/v) as the solvent. All validation parameters met ICH standards, confirming the method’s suitability for routine quality control (Skooget al., 2008).
Cite this article:
Shirkoli N, Mastiholimath V. Unveiling a New Ultra Violet-Spectrophotometric Strategy for Simultaneous Quantification of Adapalene and Erythromycin in Powders and Nanocarriers. J Young Pharm. 2025;17(3):646-52.
ACKNOWLEDGEMENT
The authors would like to thank the KLE College of Pharmacy,
Belagavi, Karnataka, for allowing them to perform this research.
ABBREVIATIONS
| API | Active Pharmaceutical Ingredient |
|---|---|
| UV | Ultra-violet |
| HPLC-MS | High Performance Liquid Chromatography-Mass Spectroscopy |
| RP-HPLC | Reverse phase-High Performance Liquid Chromatography |
| HPTLC | High Performance Thin Layer Chromatography |
| GC | Gas Chromatography |
| ICH | International Council on Harmonisation. |
References
- Arooj A., Rehman A. U., Iqbal M., Naz I., Alhodaib A., Ahmed N., et al. (2023) Development of adapalene loaded liposome based gel for acne. Gels 9: Article 135 https://doi.org/10.3390/gels9020135 | Google Scholar
- Boyd B. J., Dong Y.-D., Rades T.. (2009) Nonlamellar liquid crystalline nanostructured particles: Advances in materials and structure determination. Journal of Liposome Research 19: 12-28 https://doi.org/10.1080/08982100802691983 | Google Scholar
- Chilicka K., Gold M. H., Nowicka D.. (2023) Acne vulgaris and the most popular and new cosmetological treatments. In Journal of Cosmetic Dermatology. John Wiley & Sons, Inc. 22: 1946-1950 https://doi.org/10.1111/jocd.15757 | Google Scholar
- Feneran A. N., Kaufman W. S., Dabade T. S., Feldman S. R.. (2011) Retinoid plus antimicrobial combination treatments for acne. Clinical, Cosmetic and Investigational Dermatology 4: 79-92 https://doi.org/10.2147/CCID.S13873 | Google Scholar
- Ferenczi-Fodor K., Végh Z., Nagy-Turák A., Renger B., Zeller M.. (2001) Validation and quality assurance of planar chromatographic procedures in pharmaceutical analysis. Journal of AOAC International 84: 1265-1276 https://doi.org/10.1093/jaoac/84.4.1265 | Google Scholar
- Friedrich R. B., Ravanello A., Cichota L. C., Rolim C. M. B., Beck R. C. R.. (2009) Validation of a simple and rapid UV spectrophotometric method for dexamethasone assay in tablets. Química Nova 32: 1052-1054 https://doi.org/10.1590/S0100-40422009000400038 | Google Scholar
- ICH harmonised tripartite guideline validation of analytical procedures: Text and methodology. (2014) Retrieved from the International Conference on Harmonisation of Technical Requirements for Registration of Pharmaceuticals for Human Use, Q2(R1) https://doi.org/10.1590/S0100-40422009000400038 | Google Scholar
- Jain P. S., Chaudhari A. J., Patel S. A., Patel Z. N., Patel D. T.. (2011) Development and validation of the UV-spectrophotometric method for determination of terbinafine hydrochloride in bulk and in formulation. Pharmaceutical Methods 2: 198-202 https://doi.org/10.4103/2229-4708.90364 | Google Scholar
- Martins L. A., Meneghini L. Z., Junqueira C. A., Ceni D. C., Bergold A. M.. (2011) A simple HPLC-DAD method for determination of adapalene in topical gel formulation. Journal of Chromatographic Science 49: 796-800 https://doi.org/10.1093/chrsci/49.10.796 | Google Scholar
- Mishra M., Mundada A.. (2021) Simultaneous estimation and validation of artemether and lumefantrine by UV spectrophotometry in tablet. Journal of Drug Delivery and Therapeutics 11: 16-22 https://doi.org/10.22270/jddt.v11i2.4576 | Google Scholar
- Nagao M., Ranneh A.-H., Iwao Y., Yamamoto K., Ikeda Y.. (2023) Preparation of cubosomes with improved colloidal and structural stability using a Gemini surfactant. Molecular Pharmaceutics 20: 5066-5077 https://doi.org/10.1021/acs.molpharmaceut.3c00378 | Google Scholar
- Platon V.-M., Dragoi B., Marin L.. (2022) Erythromycin formulations-A journey to advanced drug delivery. In Pharmaceutics. MDPI 14: Article 2180 https://doi.org/10.3390/pharmaceutics14102180 | Google Scholar
- Pokala R. V., Kumari K., Bollikola H. B.. (2018) UV spectrophotometry method development and validation of Sulfadiazine and Trimethoprim in combined dosage form. International Journal of Pharmacy and Pharmaceutical Sciences 10: 103 https://doi.org/10.22159/ijpps.2018v10i1.21767 | Google Scholar
- Rathore A. S., Sathiyanarayanan L., Mahadik K. R.. (2010) Validated HPTLC method for simultaneous estimation of isotretinoin and erythromycin in bulk drug and topical gel form. American Journal of Analytical Chemistry 1: 144-149 https://doi.org/10.4236/ajac.2010.13018 | Google Scholar
- Rattanapoltaveechai R., Vongkom W., Suntornsuk W., Suntornsuk L.. (2007) Simple and rapid spectrophotometric method for the analysis of erythromycin in pharmaceutical dosage forms. Journal of Food and Drug Analysis 15: 10-14 https://doi.org/10.38212/2224-6614.2437 | Google Scholar
- Roy C., Panigrahi L., Chakrabarty J.. (2015) Validated Stability-Indicating RP-HPLC method for the estimation of degradation behaviour of organic peroxide and third-generation synthetic retinoids in topical pharmaceutical dosage formulation. Scientia Pharmaceutica 83: 321-338 https://doi.org/10.3797/scipharm.1412-10 | Google Scholar
- Rozet E., Ceccato A., Hubert C., Ziemons E., Oprean R., Rudaz S., Boulanger B., Hubert P., et al. (2007) Analysis of recent pharmaceutical regulatory documents on analytical method validation. Journal of Chromatography. A 1158: 111-125 https://doi.org/10.1016/j.chroma.2007.03.111 | Google Scholar
- Sanchez J. M.. (2018) Estimating detection limits in chromatography from calibration data: Ordinary least squares regression vs. weighted least squares. Separations 5 https://doi.org/10.3390/separations5040049 | Google Scholar
- Sayyafan M. S., Ramzi M., Salmanpour R.. (2020) Clinical assessment of topical erythromycin gel with and without zinc acetate for treating mild-to-moderate acne vulgaris. The Journal of Dermatological Treatment 31: 730-733 https://doi.org/10.1080/09546634.2019.1606394 | Google Scholar
- Sharma S., Goyal S., Chauhan K.. (2018) In International Journal of Applied Pharmaceutics Array: 8-15 https://doi.org/10.22159/ijap.2018v10i6.28279 | Google Scholar
- Sivadasan D., Sultan M. H., Alqahtani S. S., Javed S.. (2023) Cubosomes in drug delivery-A comprehensive review on its structural components, preparation techniques and therapeutic applications. In Biomedicines. MDPI 11: Article 1114 https://doi.org/10.3390/biomedicines11041114 | Google Scholar
- Skoog D. A., Holler F. J., Crouch S. R.. (2008) Principles of instrumental analysis. Recording for the blind and dyslexic. https://doi.org/10.3390/biomedicines11041114 | Google Scholar
- Thummar K., Tilva K., Dudhatra B., Mardia R., Sheth N.. (2020) Validated stability-indicating HPTLC method for the estimation of adapalene in drugs and the LC-MS identification of its degradation products. JPC-Journal of Planar Chromatography – Modern TLC 33: 371-380 https://doi.org/10.1007/s00764-020-00042-z | Google Scholar
- Tsuji K., Robertson J. H.. (1971) Determination of erythromycin and its derivatives by gas-liquid chromatography. Analytical Chemistry 43: 818-821 https://doi.org/10.1021/ac60302a009 | Google Scholar
- Uday T. C., Shivabasappa P. M., Sanjay S. S., Maruti M. S.. (2021) Development and validation of stability indicating uv-spectrophotometric method for the simultaneous estimation of telmisartan and metformin hydrochloride in bulk drugs. Indian Journal of Pharmaceutical Education and Research 55: 590-597 https://doi.org/10.5530/ijper.55.2.98 | Google Scholar
- Varachhiya H. J., Barse R. K., Jain S.. (2019) Development and validation of spectroscopic simultaneous equation method for simultaneous estimation of itopride hydrochloride and omeprazole in synthetic mixture. Asian Journal of Pharmaceutical Research 9: 238 https://doi.org/10.5958/2231-5691.2019.00038.8 | Google Scholar
- Waller D. G., Sampson A. P.. (2018) In Medical pharmacology and therapeutics : 561-568 https://doi.org/10.1016/B978-0-7020-7167-6.00049-X | Google Scholar
- Williams H. C., Dellavalle R. P., Garner S.. (2012) Acne vulgaris. The Lancet 379: 361-372 https://doi.org/10.1016/S0140-6736(11)60321-8 | Google Scholar
