ABSTRACT
Objectives
This study explores microscopic features, physicochemical properties, preliminary phytochemical profile, antioxidant and antibacterial activity of Ludwigia palustris.
Materials and Methods
Macroscopic and microscopic examination was carried out to detail the stomata type, transverse section anatomy, trichome structure, and anatomical features. Physicochemical characteristics such as ash value, extractive value, loss on drying, swelling index, foaming index, foreign organic substance, and crude fiber content were analyzed for standardization of the crude drug. The presence of phytochemicals was analyzed qualitatively by elemental and phytochemical screening of different extracts. Total phenolic, flavonoid, and tannin contents were analyzed quantitatively, in addition to Thin-Layer Chromatography (TLC) profiling for the detection and isolation of bioactive compounds. Antioxidant activities were determined through DPPH; hydrogen peroxide free radical scavenging and reducing power assays. Antibacterial activity was tested against both Gram-positive and Gram-negative bacteria by disk diffusion method.
Results
Microscopy showed characteristic features, such as anomocytic stomata, unicellular trichomes, and aerenchymatous tissue. Parameters for standardization were developed. Phytochemical screening showed the presence of flavonoids and phenolics; TLC detected at least six flavonoids and thirteen phenolic compounds. The chloroform extract was rich in antioxidant but poor in antibacterial activity, while the ethanol extract was moderate in antioxidant and had promising broad-spectrum antibacterial activity.
Conclusion
Ludwigia palustris is rich in phenolics and has high antioxidant and antibacterial activity. The results indicate the presence of potentially new bioactive compounds, which deserve to be studied further for potential therapeutic uses, particularly in the fight against bacterial resistance and oxidative stress.
INTRODUCTION
Aquatic and semi-aquatic plants are plants that grow in or near water, and they have been used for medicinal purposes for centuries. Many aquatic and semi-aquatic plants have been shown to have medicinal properties, and they are used in traditional and modern medicine to treat a wide range of conditions.
Ludwigia genus contains various types of secondary metabolites majorly Flavonoids, such as quercetin and kaempferol, are widely reported and contribute to antioxidant properties. Phenolic acids, like gallic and Rosmarinic acid, are also common, potentially aiding in anti-inflammatory effects. Triterpenoids, including oleanolic and ursolic acid, are noted for their antimicrobial potential. Saponins, particularly complex ones, are unique to certain species and may have cytotoxic or antidiabetic effects. Other compounds, like sterols and volatile oils, are less frequently studied but present (Shawkyet al., 2023).
The Genus Ludwigia has been studied well for medicinal uses as it has its importance in folk medicines, but the plant in research Ludwigia palustris has not been studied for its medicinal potential, we have assessed its various standardization parameters, preliminary phytochemical studies, antioxidant and antibacterial activity of promising extracts. We aim to explore its potential as alternative to synthetic counterparts in antibacterial activity as well as antioxidant activity. Ludwigia palustris has been reported to be consumed by native Americans (Timothy Coffey, 1993). Genus Ludwigia is known to be rich in polyphenolic contents and various types of other secondary metabolites, we also have detected the presence of polyphenolics, flavonoids, as indicated by chemical tests and TLC studies (Mangaoet al., 2020; Shilpiet al., 2010; Yan and Yang, 2006). Extracts also showed promising presence of phenols, flavonoids and tannins in Total content studies. The extracts that showed a good quantity of secondary contents were employed for antioxidant and antibacterial activity, which also shows promising results.
Although Ludwigia palustris is an edible plant with reported ethnomedicinal uses, its medicinal potential remains underexplored (Timothy, 1993). There is a lack of comprehensive studies identifying its bioactive compounds, particularly those with antibacterial and antioxidant activity. With rising antimicrobial resistance and the need for safe natural antioxidants, L. palustris could be a promising source (Chinemerem Nwobodoet al., 2022). However, limited research exists linking its phytochemical content to its biological activities, thus we aim to fill the gap and explore the plant for potential medicinal uses and chemical constituents.
Ludwigia palustris (L.) Elliott, is a species of flowering plant belonging to the Onagraceae (evening primrose) family, within the order Myrtales and genus Ludwigia (Rojas-Sandoval, 2020). Commonly referred to as marsh purslane, water purslane, or Hampshire-purslane, this perennial herb is native to North America and typically inhabits wetland and aquatic environments. The plant features creeping stems that can grow up to 5.75 inches in length and narrow, elliptical leaves measuring approximately 0.28-1.77 inches long and 0.16-0.91 inches wide, with short petioles. Its small, yellow flowers have four sepals, four stamens, and fleshy four-lobed structures, though petals may be absent. The fruit is a box-like, elongated spherical capsule (0.08-0.2 inches long), containing seeds arranged in indistinct rows. These seeds are small, measuring 0.02-0.04 inches in length (Aquaplant.Edu, 2018; Plants. ces, 2018, Plants. ces, 2018). Roots typically develop at the nodes. Ludwigia palustris (Figures 1 and 2) is valued in natural landscaping and wetland restoration and has been used in traditional medicine as a diuretic and for respiratory ailments.
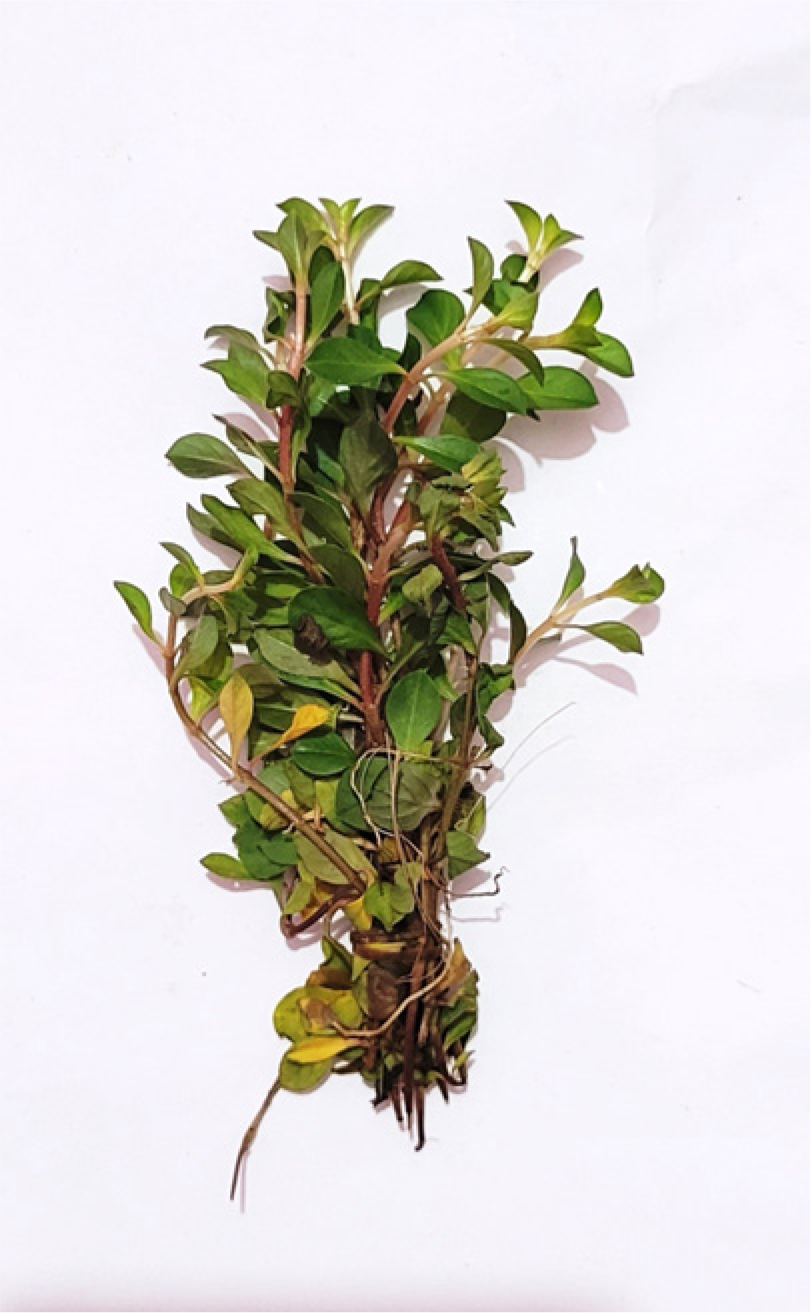
Figure 1:
Bunch of Ludwigia palustris.
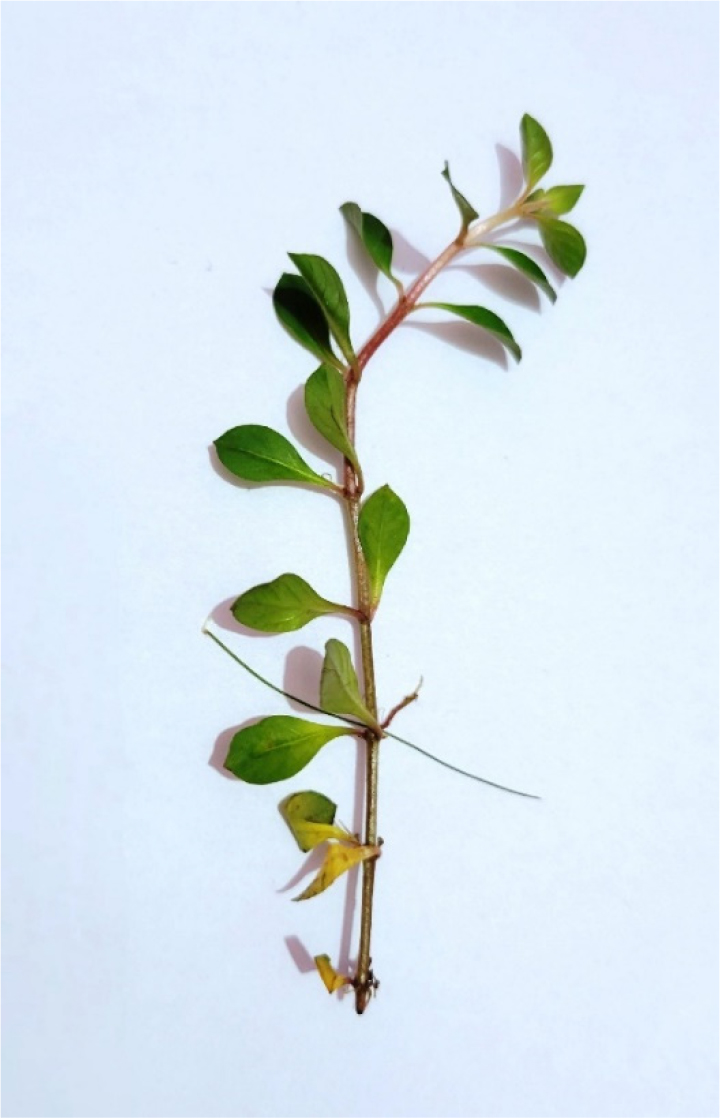
Figure 2:
Close up of Ludwigia palustris.
MATERIALS AND METHODS
Crude drug procurement
Ludwigia palustris (L.) Elliott was procured from ohmletsshoppe.com, the green park complex, Kuravilangad, Kerala (India). The sample was identified based on exomorphic characters, chemical reaction and reviews of literature by Dr. Karan Singh, Taxonomist, DSVV (Haridwar). The voucher specimen of the sample (DSVV/MPS/GEN//2023/03/D.O. 0039) was deposited in the Medicinal plant science department herbarium of Dev Sanskriti Vishwa Vidyalaya, Rishikesh Road, Haridwar (Uttarakhand).
Macroscopic study
Macroscopic and organoleptic studies were conducted on intact and powdered materials. The sample were washed when it was fresh, air dried in shade and observed for color, shape, odour, taste, size, and other surface characteristics. The aerial (Whole Plant) was powdered and observed for organoleptic characters (Khandelwal., 2008).
Microscopic study of the plant
Microscopic and morphological study was done using binocular light microscope (AxL, LABO, Germany), cross sections were prepared by free hand sectioning which was cleared using chloral hydrate, stained with Freshly prepared safranin, and alcohols of different grades to enhance the visibility and highlight the cellular structures (Khandelwal K.R., 2003). all the images were taken by author using Sony digital camera (Model DSC-W-810).
Physicochemical analysis of plant
Air dried aerial part was used for the quantitative determination of ash values (Total ash, Acid insoluble and water soluble), extractive values, Loss on Drying, swelling index, foaming index and foreign organic matter, Crude fiber content, and Qualitative analysis of inorganic elements via standard methods. Extractive values with petroleum ether, chloroform, ethanol and water were also determined. All the tests were performed in triplicate to get better results. (AOAC, 1982; Khandelwal K.R., 2008; Quality control methods for medicinal plant materials, 1998).
Preparation of extracts
The successive extraction process involved exhaustively extracting 35 g of air-dried, coarsely powdered plant material in a Soxhlet apparatus for 8 hr with each solvent in the following order: Diethyl ether, chloroform, ethyl acetate, acetone, and ethanol (95%). After each extraction, the extract was filtered and evaporated under reduced pressure using a Rota-vapor (Heidolph, Heizbad, Laborota 4001, Germany, 2000). Solvents were bought from CDH-fine chemicals. The extracted plant material was air-dried and repacked into the Soxhlet apparatus before the next solvent extraction. The yield, color, and consistency of each extract were recorded (Khandelwal K.R., 2003).
Chemical Tests
Phytochemical screening was done to detect various types of bioactive compounds through standard qualitative tests. For alkaloids, Dragendorff’s reagent, Mayer’s test, Hager’s test, and Wagner’s test were utilized, Saponins were identified by the froth formation and haemolytic tests based on their capacity to form stable foam and cause lysis of red blood cells. Sterols were detected using the Libermann-Burchard and Salkowski tests. Carbohydrates were identified by the Molisch test, which gives a purple ring when alpha-naphthol and sulfuric acid are present, and reducing sugars were identified using Fehling’s and Benedict’s tests based on the red precipitate formation. Starch was tested using the iodine test with blue-black coloration and the jelly test for gel production on heating and cooling. Fats were detected using the grease spot test with translucence on paper and the emulsification test for emulsion formation with water. Proteins were also identified using the ninhydrin test, which gives a purple color in the presence of amino acids, and the biuret test, which results in a violet color in the presence of peptide bonds. Glycosides were identified using a series of tests: Borntrager’s test (red color for anthraquinone glycosides), foam test, Libermann-Burchard test, Keller-Killiani test, Legal test (for cardiac glycosides), ferric chloride test (for phenolic glycosides), and trichloroacetic acid test. Flavonoids were detected by ammonia test (UV fluorescence), Shinoda test (pink or reddish coloration), and vanillin hydrochloride test (reddish coloration). Tannins and phenolics were analyzed by iron salts (blue-green coloration), gelatin (precipitation), and tests with ammonia and bromine water. Iridoids, in turn, were detected through the Trim-Hill reagent test, which causes a distinctive color reaction on detection. All the chemicals were procured from SRL and CDH fine chemicals (Harbourne J.B., 1998).
TLC study of the extracts
For every residue, several solvent systems were assessed, and the systems that produced acceptable resolution were noted. Merck Precoated Silica Gel GF 254 Aluminium TLC plates were used to develop each chromatogram. All solvents were of CDH-Fine analytical grade chemicals. The solvent systems Chloroform:Acetone:Formic Acid (60:30:10) and Ethyl Acetate:Water:Formic Acid (80:10:10) were created for flavonoids, and the corresponding chromatograms were recorded. The solvent systems Toluene:Ethyl Acetate (60:40) and Toluene:Acetone (70:30) were created for phenolics, and this produced a good number of different spots. The spots were examined using spraying reagent (vanillin-sulfuric acid reagent), visible light, and short-wavelength UV (254 nm) and long-wavelength UV (365 nm). After counting all the spots, the Rf values were determined using the formula below:
Rf=Distance travelled by the compound / Distance travelled by the solvent front. (Stahl Egon, 2005; Waksmundzka-Hajnos Monikaet al., 2008)
Total content determination of extracts
Total Phenolic content determination
Various concentrations of gallic acid, as 0.00, 0.25, 0.50, 0.75, and 1 mM, were used for the calibration. After mixing 200 μL of extracts (10 mg/mL) with 2.0 mL of solution A (which consisted of 10 mL of 2% Na2CO3, 0.1 mL of CuSO4, and 0.1 mL of sodium and potassium tartrate), 0.4 mL of 0.5 M sodium hydroxide was added after 4 min. 0.2 mL of Folin-Ciocalteu reagent (1:1 v/v with water) was added after 10 min. After 30 min, the absorbance of the solution was measured at 750 nm using a UV-vis spectrophotometer (Agilent Cary-60 UV-visible double beam spectrophotometer). Using a gallic acid calibration curve, the total phenolic content was determined as mM gallic acid equivalent (mM GAE) all the values were taken in triplicate (n=3) (Noreenet al., 2017).
Total flavonoid content determination
In a 10 mL volumetric flask, 10 mg of quercetin was weighed and mixed with 10 mL of methanol. To create the 100 mcg/mL quercetin standard solution (stock solution), 1 mL of the solution (1 mg/mL) was pipetted out and mixed with 10 mL of methanol. Solutions with concentrations of 25, 50, 75, 100, 125, and 150 mcg/mL were made from the stock solution. 4 mL of water and 0.3 mL of 5% sodium nitrite were added to each of them. 2 mL of 1M sodium hydroxide were added at 6 min, followed by 0.3 mL of a 10% aluminium chloride solution after 5 min. Distilled water was used to get the total amount up to 10 mL. Without adding the aluminium chloride solution, a blank was made. After thoroughly mixing the solutions, a UV-visible spectrophotometer was used to measure the absorbance at 510 nm against the blank. Using different quercetin (Bought of Sigma Aldrich) concentrations and the related absorbance, a standard graph was created. All the values were taken in triplicate (n=3) (Chandran and Kavitha Chandran, 2016).
Total Tannin Content determination
The Folin-Ciocalteu technique was used to determine the tannins. A volumetric flask (10 mL) containing 7.5 mL of distilled water, 0.5 mL of Folin-Ciocalteu phenol reagent, 1 mL of 35% sodium carbonate solution, and 10 mL of distilled water was filled with about 0.1 mL of the sample extract. After giving the mixture a good shake, it was allowed to sit at room temperature for half an hour. Tannic acid reference standard solutions (20, 40, 60, 80, and 100 µg/mL) were made using the previously mentioned technique. Using a UV/visible spectrophotometer, the absorbance of the test and standard solutions was measured at 700 nm against the blank. Three separate measurements were made to estimate the tannin concentration. In milligrams of tannic acid equivalents per gram of dried sample, the tannin concentration was reported all the values were taken in triplicate (n=3) (Chandran and Kavitha Chandran, 2016).
Antioxidant activities of Extracts
DPPH antioxidant activity
The free radical scavenging activity of the Ludwigia palustris Chloroform Extract (LPCE) Ludwigia palustris Acetone Extract (LPAE) and Ludwigia palustris Ethanol Extract (LPEtE), were tested using a 1,1-diphenyl-2-picryl hydrazyl (DPPH) technique. DPPH was dissolved in methanol to prepare a 0.1 mM solution. It was kept in dark container to prevent photodegradation. Different concentrations of the plant extract were prepared in methanol (20, 40, 60, 80, and 100 µg/mL). In test tube,1 mL of DPPH solution was mixed with 1 mL of plant extract at each concentration. For the control, mix 1 mL of DPPH solution with 1 mL of methanol (without plant extract) was used. The reaction mixture was allowed to incubate in the dark at room temperature for 30 min. The absorbance was measured of each sample at 517 nm using UV-vis spectrophotometer. The values were taken in duplicate, and DPPH was bought from SRL chemicals (Liyana-Pathirana and Shahidi, 2005).
The inhibition of DPPH was calculated as a percentage of radical scavenging activity of each extract using the formula:
Percentage of radical scavenging activity=[(AControl- ASample)/ Acontrol]×100
Reducing Power
After combining 1.0 mL of extract with 2.5 mL of potassium ferricyanide (30 mM) and phosphate buffer (200 mM, pH 6.6), the mixture was incubated for 20 min at 50°C. After adding 2.5 mL of 600 mM trichloroacetic acid (Sigma Aldrich) to the reaction mixture, it is centrifuged for 10 min at 3000 rpm. Absorbance was measured at 700 nm when the top layer of solution (2.5 mL) is combined with 2.5 mL of distilled water and 0.5 mL of FeCl3 (6 mM). However, BHT, or butylated hydroxytoluene, was used as a positive control. Values were taken in duplicate (Chanda and Dave, 2009).
H2O2 Scavenging activity
Rapid breakdown of H2O2 into oxygen and water within the body might result in the production of Hydroxyl Radicals (OH˙), which can start lipid peroxidation and damage DNA. A 40 mM solution of hydrogen peroxide was made in 50 mM phosphate buffer (pH 7.4). A UV-visible spectrophotometer was used to measure absorbance at 230 nm to calculate the hydrogen peroxide content. Hydrogen peroxide was mixed with extract (20-60 µg/mL) in distilled water, and after 10 min, the absorbance at 230 nm was measured against a blank solution that contains phosphate buffer without hydrogen peroxide. Values were taken in duplicate. The following formula was used to determine the percentage of hydrogen peroxide scavenging:
% Scavenged (H2O2)=(A0 – A1 / A0)×100
Where, A0 is the absorbance of control and A1 is the absorbance of test. BHT was used as positive control (Chanda and Dave, 2009).
Antibacterial activity of Extracts
The experiment was performed on Mueller-Hinton agar. The agar was filled in sterile petri plates and left to solidify. A suspension of B. cereus (MTCC-9411) and E. coli (MTCC-731) bacteria was made in sterile saline (0.85% NaCl), and the turbidity was standardized to the 0.5 McFarland standard (~1.5 × 10⁸ CFU/mL). With a sterile cotton swab, the bacterial suspension was uniformly spread across the entire surface of the agar plate to provide an even lawn. A sterile cork borer was employed to punch wells (6-8 mm in diameter) into the agar. The agar plugs were gently removed to make wells for the plant extracts. Next, 100 µL of each of the plant extracts (made in chloroform, acetone and ethanol) was placed into the respective wells with a sterile micropipette. For the positive control, a ciprofloxacin standard antibiotic solution was added, and for the negative control, the pure solvent that was used to make the extracts was added. The plates were left to stand for 30 min at room temperature to allow diffusion of the extracts into the agar. The plates were incubated at 37°C for 18-24 hr. Following incubation, the diameter of the clear inhibition zones around each well was measured with a ruler. The results were measured in millimetres (mm) (Negiet al., 2012).
RESULTS
Macroscopic studies
The organoleptic characteristics of the plant powder exhibit a greyish green color and a grassy odor. It has a slightly salty taste and a smooth consistency, typical of the delicate and moist texture found in aquatic or semi-aquatic herbs.
Microscopic Studies
The transverse section of the stem (Figure 3) displays characteristic structures typical of semi-aquatic plants, notably the presence of aerenchyma tissue. At higher magnification (450X), the leaf surface exhibits anomocytic stomata, as shown in Figure 4. Additionally, the plant bears unicellular trichomes, which are sparsely distributed across the leaf surface (Figure 5). Physicochemical parameters were evaluated and are summarized in Table 1. For extract preparation, the plant material was subjected to Soxhlet extraction, and the characteristics of the resulting extracts are listed in Table 2. The extracts were stored in a desiccator and used within seven days of extraction. Preliminary chemical screening (Table 3) indicated the presence of flavonoids and phenolic compounds, while other phytochemicals were absent.
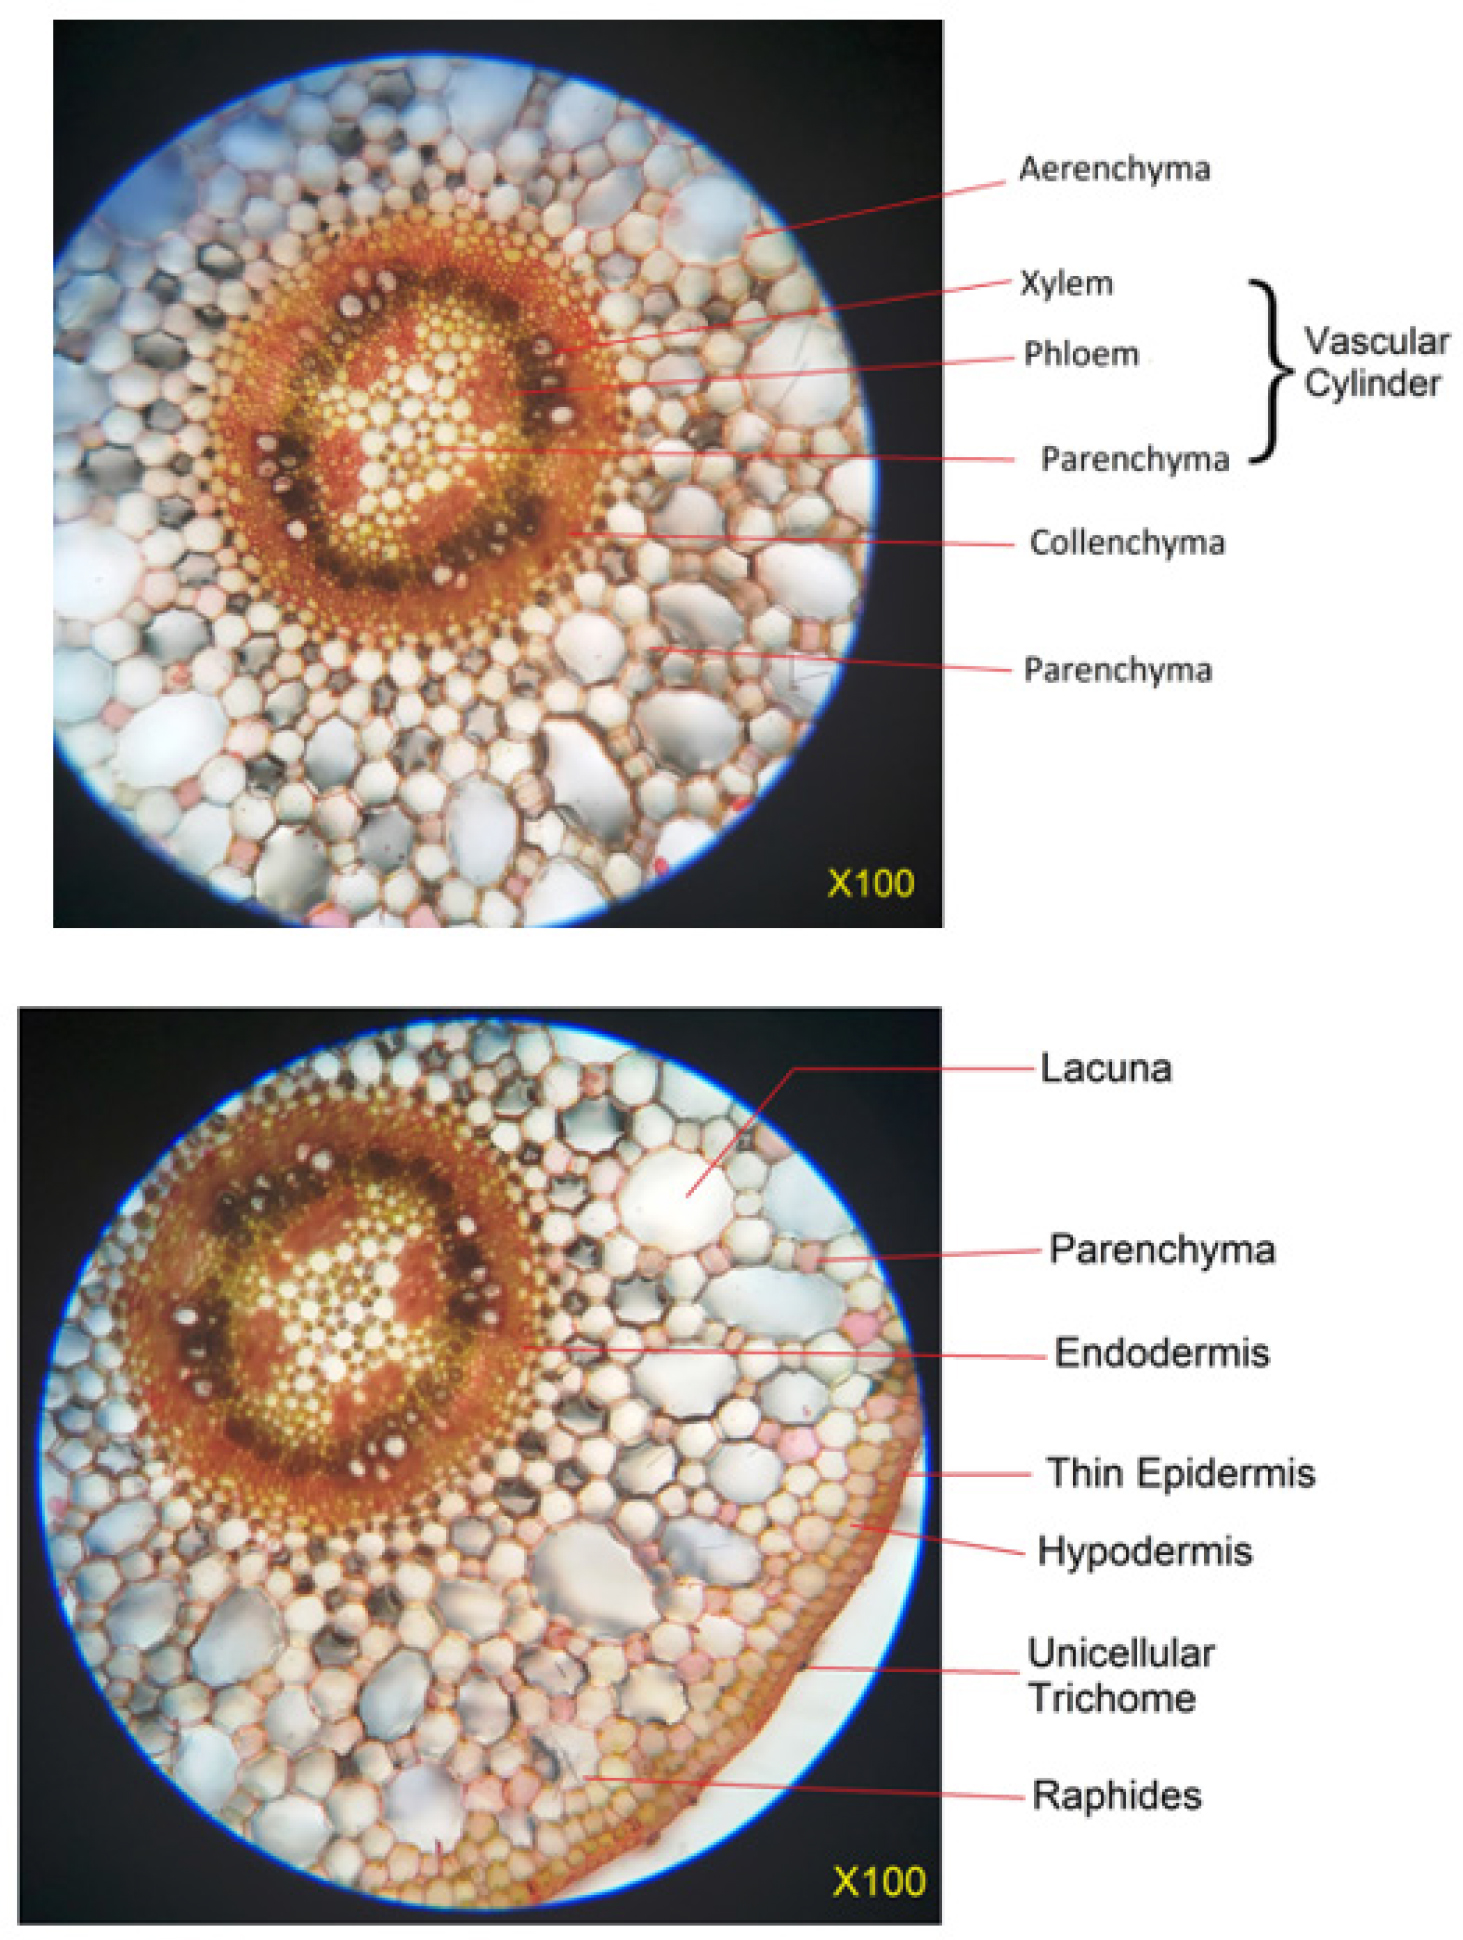
Figure 3:
T.S. of Ludwigia palustris at 100X.
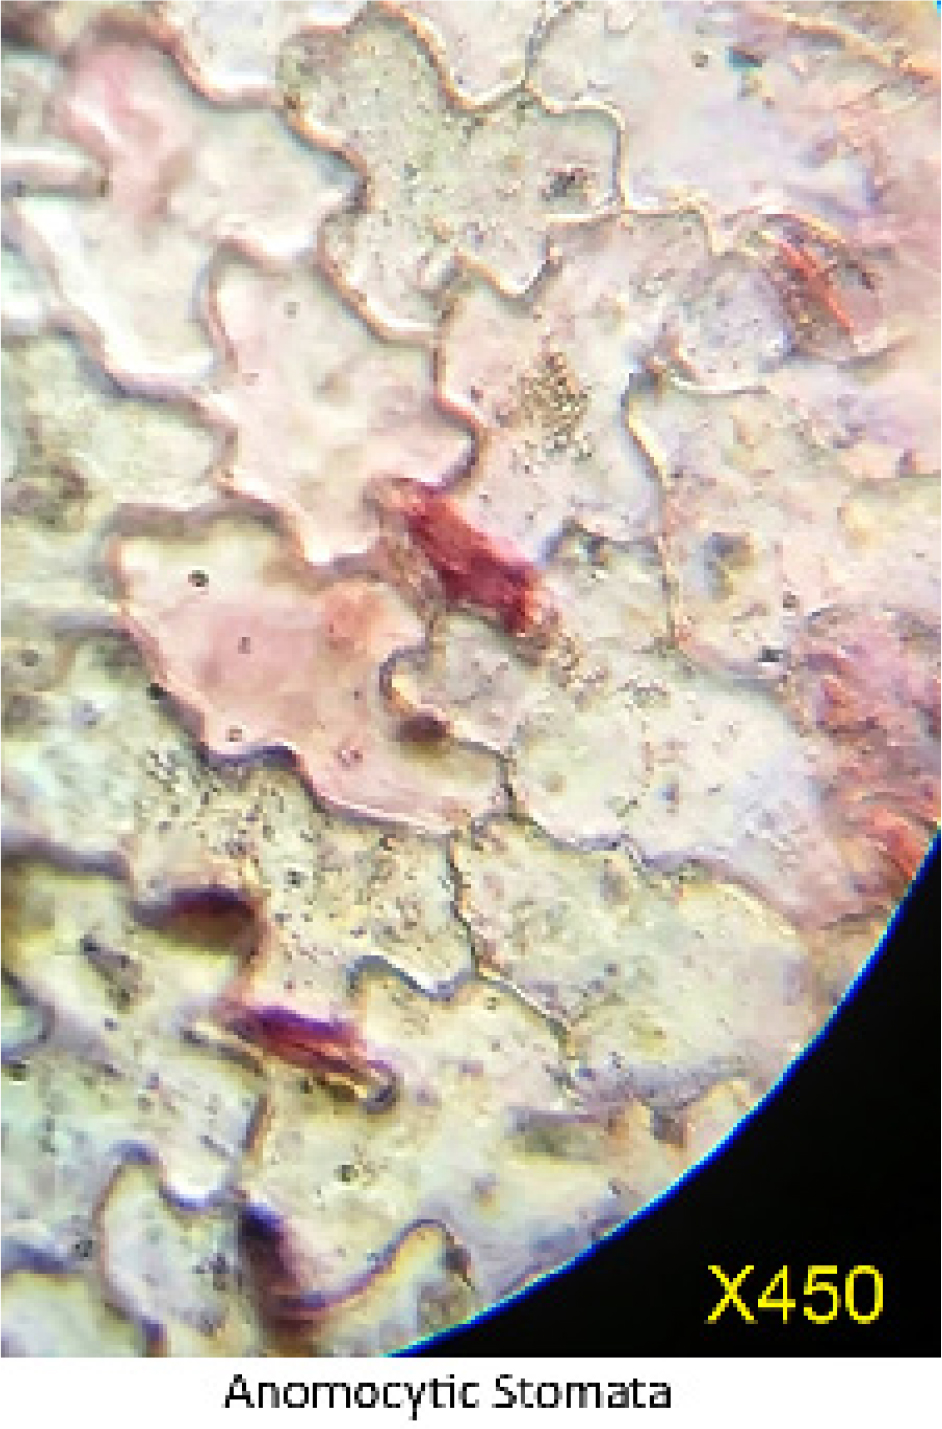
Figure 4:
Anomocytic stomata on the leaf.
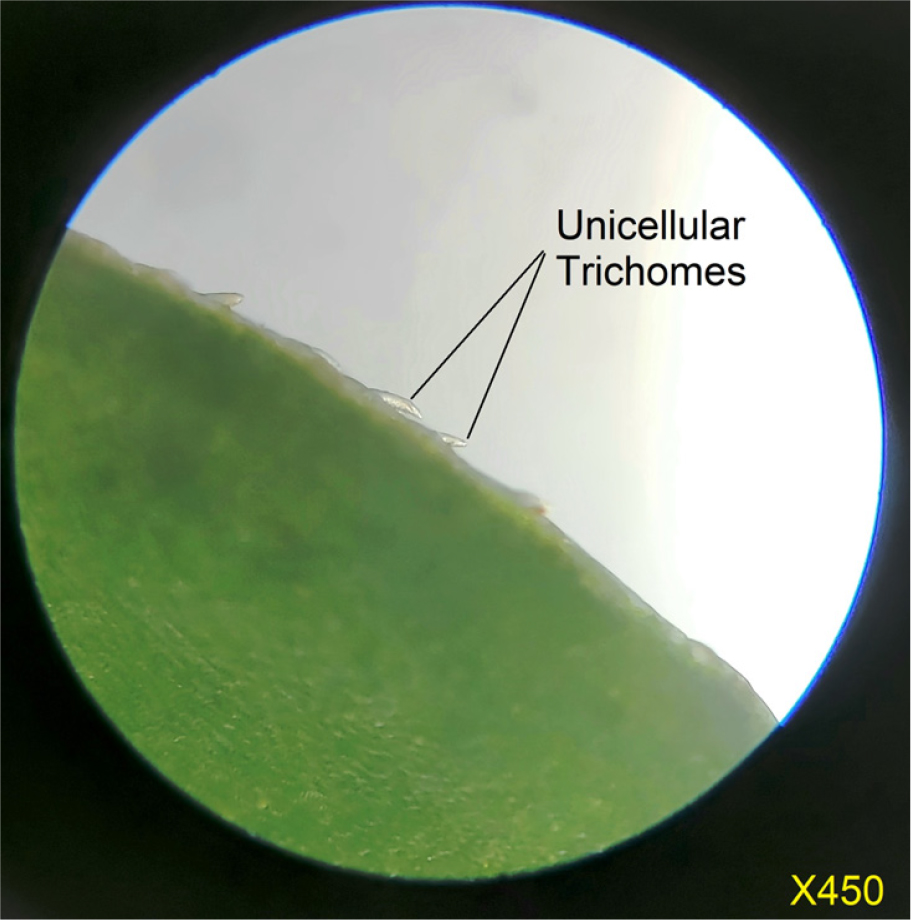
Figure 5:
Unicellular Trichomes on the leaves.
| Parameters | Sub-category | Values |
|---|---|---|
| Ash Value | Total Ash Value | 10.3%±0.11 |
| Acid insoluble Ash Value | 1.33%±0.01 | |
| Water soluble Ash Value | 5.35%±0.08 | |
| Extractive Value | Ether extractive Value | 1.08%±0.05w/v |
| Chloroform extractive Value | 3.66%±0.15 w/v | |
| Ethanol (90%) extractive Value | 11%±0.1 w/v | |
| Aqueous extractive Value | 11.08%±0.46 w/v | |
| Loss on Drying | – | 10.99%±0.08 |
| Swelling index | – | 0.0±0 |
| Foaming Index | Less than 100 | Insignificant |
| Foreign organic matter | – | 0.99% |
| Crude fiber content | – | 6.6%±0.55 |
| Qualitative Elemental Study | Iron | Positive |
| Magnesium | Positive | |
| Potassium | Positive | |
| Aluminium | Positive | |
| Sulphates | Positive |
| Extract | % dry weight (in gram) | % Yield | Colour | Consistency |
|---|---|---|---|---|
| Diethyl Ether | 1.68 | 4.8% | Dark Green | Sticky and smooth |
| Chloroform | 1.08 | 3.1% | Dark Green | Sticky and Hard |
| Ethyl Acetate | 1.33 | 3.8% | Green | Non-Sticky and Dry |
| Acetone | 2.69 | 7.6% | Brownish Green | Non-Sticky and Dry |
| Ethanol (95%) | 5.6% | 16.0% | Dark Brown | Dry |
| Type of constituents | LPEE | LPCE | LPEAE | LPAE | LPEtE |
|---|---|---|---|---|---|
| Alkaloids | – | – | – | – | – |
| Saponins | – | – | – | – | – |
| Sterols | – | – | – | – | – |
| Carbohydrates | – | – | – | – | + |
| Starch | – | – | – | – | – |
| Fatty acids | – | – | – | – | – |
| Proteins | – | – | – | – | – |
| Triterpenes | – | – | – | – | – |
| Flavonoids | + | + | – | + | + |
| Phenolics | + | + | – | + | + |
| Iridoids | – | – | – | – | – |
Comprehensive physicochemical analysis
The study involved a comprehensive physicochemical analysis, with various parameters detailed in Table 2. Extracts were prepared using a Soxhlet apparatus, and their characteristics are presented in Table 3. After extraction, the samples were stored in a desiccator and utilized within seven days. Chemical tests, also summarized in Table 3, revealed the presence of flavonoids and phenolics in the plant extracts, indicating their potential bioactive properties.
TLC studies
TLC studies were conducted to analyze flavonoids, phenolics, and chalcones using various solvent systems. For flavonoids, the first solvent system comprising ethyl acetate: water: formic acid (80:10:10) revealed a total of six spots, with common Rf values counted as one, as shown in Table 4. A second solvent system using chloroform: acetone: formic acid (60:30:10) was also employed for flavonoid analysis, revealing six spots in acetone and ethanol extracts (Table 5). For phenolics and chalcones, the solvent system toluene: ethyl acetate (60:40) was used, yielding 13 distinct spots (Table 6). Additionally, a second system of toluene: acetone (70:30) identified 10 spots (Table 7), demonstrating the presence and diversity of phenolic and chalcone compounds in the extracts.
| Sl. No. | Type of detection | Extract | Rf Values |
|---|---|---|---|
| 1. | Visible | LPAE LPEE | 0.84, 0.88 0.84, 0.88 |
| 2. | Long U.V. | Not observed | |
| 3. | Short U.V. | LPAE LPEtE | 0.84, 0.88 0.84, 0.88 |
| 4. | After spraying (Vanillin Sul.) | LPCE LPEAE LPAE LPEtE | 0.74, 0.84, 0.88 0.57, 0.61, 0.74, 0.84, 0.88 0.57, 0.74, 0.84, 0.88 0.10 |
| Type of detection | Extract | Rf Values |
|---|---|---|
| Visible | LPAE | 0.74 |
| Long U.V. | LPAE LPEtE | 0.25 0.25 |
| Short U.V. | Not Observed | |
| After spraying (Vanillin Sul.) | LPAE LPEtE | 0.13, 0.18, 0.25, 0.74, 0.80 0.13, 0.25, 0.54 |
| Type of detection | Extract | Rf Values |
|---|---|---|
| Visible | LPEE LPCE LPAE | 0.50, 0.91, 0.94, 0.20, 0.50, 0.74, 0.88, 0.91, 0.94 0.50, 0.88, 0.91, 0.94 |
| Long U.V. | LPEE LPCE LPEAE LPAE LPEtE | 0.91, 0.94 0.20, 0.26, 0.50, 0.59, 0.74, 0.88, 0.91 0.20 0.20, 0.59, 0.88, 0.91 0.30 |
| Short U.V. | LPEE LPCE LPAE | 0.91, 0.94 0.50, 0.74, 0.91 0.91, 0.94 |
| After spraying (Vanillin Sul.) | LPEE LPCE LPEAE LPAE | 0.69 0.29, 0.69, 0.81 0.29 0.69, 0.29 |
| Sl. No. | Type of detection | Extract | Rf Values |
|---|---|---|---|
| 1. | Visible | LPCE LPAE | 0.45, 0.60, 0.93, 0.96 0.45, 0.60, 0.96 |
| 2. | Long U.V. | LPCE LPAE LPEtE | 0.30, 0.45, 0.60, 0.82, 0.93, 0.96 0.45, 0.60, 0.82 0.41 |
| 3. | Short U.V. | LPCE LPAE | 0.45, 0.60 0.45, 0.60 |
| 4. | After spraying (Vanillin Sul.) | LPEE LPCE LPEAE LPAE LPEtE | 0.67, 0.96 0.28, 0.30, 0.45, 0.78, 0.82 0.28, 0.45, 0.78 0.41 |
Total Contents
Total Phenolic content: Phenolic content was measured using the Folin-Ciocalteu reagent in each extract. The results were derived from a calibration curve (y=0.0066x+0.0003, R2=0.998) of gallic acid and expressed in Gallic Acid Equivalents (GAE) per gram dry extract weight (Table 8). The content of phenolic compounds in Di ethyl ether extracts, Chloroform extract, ethyl acetate extract, acetone extract and ethanol extract were 47.43±1.15, 404.015±1.51, 85.075±0.75, 312.85±2.31 and 236.08±0.43 GAE/g respectively.
| Extract | Total Phenolic Content (GAE/g) | Total Flavonoid Content (QE/g) | Total Tannin Content (TAE/g) |
|---|---|---|---|
| LPEE | 47.43±1.15 | 18.98±1.02 | 23.33±0.41 |
| LPCE | 404.015±1.51 | 154.53±0.67 | 316.90±8.25 |
| LPEA | 85.075±0.75 | 139.42±0.38 | 81.19±4.12 |
| LPAE | 312.85±2.31 | 147.67±2.31 | 188.33±4.12 |
| LPEtE | 236.08±0.43 | 64.53±0.67 | 102±4.12 |
Total flavonoid content: Flavonoid content was measured using the aluminium chloride in a colorimetric method. The results were derived from a calibration curve (y=0.003x+0.0108, R2=0.99) of gallic acid and expressed in Quercetin Equivalents (QE) per gram dry extract weight (Table 8). The content of flavonoid compounds in Di ethyl ether extracts, Chloroform extract, ethyl acetate extract, acetone extract and ethanol extract were 18.98±1.02, 154.53±0.67, 139.42±0.38, 147.67±2.31 and 64.53±0.67 QE/g respectively.
Total Tannin Content: Total Tannin content was measured using the Folin-Ciocalteu reagent. The results were derived from a calibration curve (y=0.0007x+0.0027, R2=0.988) of tannic acid and expressed in Tannic Acid Equivalents (TAE) per gram dry extract weight (Table 8). The content of tannins compounds in Di ethyl ether extracts, Chloroform extract, ethyl acetate extract, acetone extract and ethanol extract were 23.33±0.41, 316.90±8.25, 81.19±4.12, 188.33±4.12 and 102±4.12 TAE/g respectively.
Antioxidant Activity
DPPH scavenging activity: Figure 6 shows the DPPH free radical scavenging activity of ascorbic acid (used as standard), Chloroform extract, Acetone extract and Ethanol extracts, (only three were chosen based on the bands on TLC plate and chemical tests). p-value was calculated using one-way Anova as 0.0102, so it can be concluded that there are significant differences among at least some groups regarding their antioxidant activities compared to the standard (ascorbic acid). IC50 value was calculated using GraphPad prism version 8.2, which is given in Table 9.
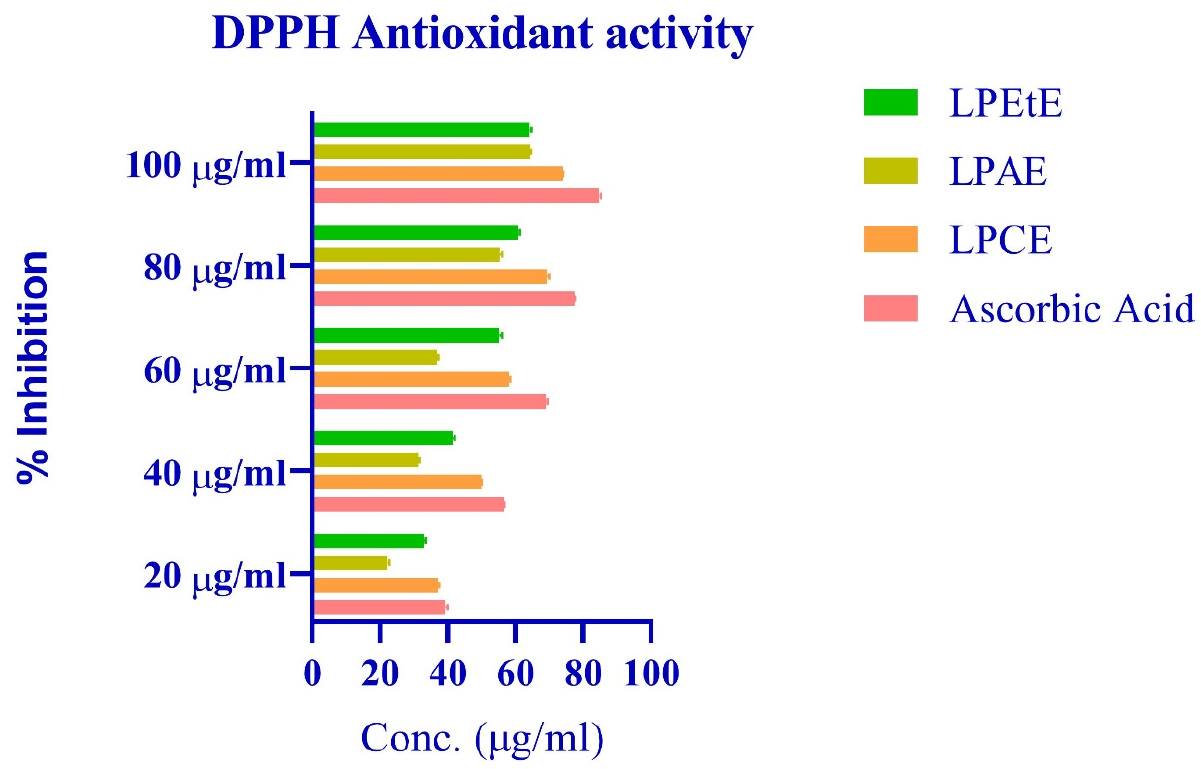
Figure 6:
Graph showing %inhibition of various extracts using DPPH method.
| Substance | DPPH scavenging activity (IC50 μg/mL) | H2O2 free radical scavenging activity IC50 (μg/mL) | Reducing power Activity IC50 (μg/mL) |
|---|---|---|---|
| Ascorbic acid | 32.27 | – | – |
| Butylated Hydroxy Toluene (BHT) | – | 15.93 | 157.14 |
| LPCE | 39.78 | 26.79 | 217.02 |
| LPAE | 74.22 | 46.23 | 255.00 |
| LPEtE | 52.49 | 28.03 | 200.00 |
H2O2 Scavenging activity: Figure 7 shows the H2O2 Scavenging activity of BHT (used as standard), Chloroform extract, Acetone extract and Ethanol extracts. Acetone has the highest IC50 (Table 9), suggesting it is the least effective among the tested substances, chloroform is most effective, and ethanol extract is second most effective in this test. p-value is 0.0049, which is significantly below 0.05, indicating that there is a statistically significant difference among the antioxidant activities of the different extracts and the BHT standard.
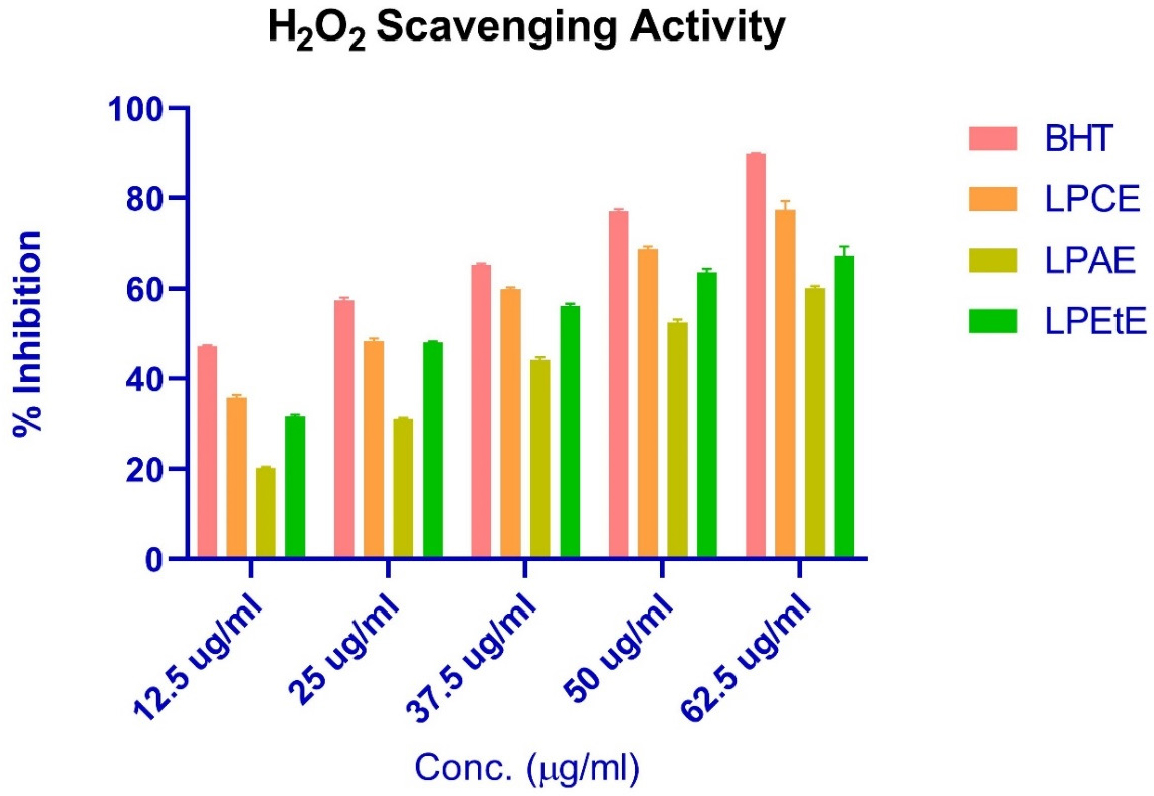
Figure 7:
H2O2 Scavenging activity of various extracts.
Reducing Power activity: Figure 8 shows the reducing power activity of BHT (used as standard), Chloroform extract, Acetone extract and Ethanol extracts. Lower IC50 values indicate higher reducing power activity (more potent antioxidant activity). BHT, the standard, has the lowest IC50 (157.14 µg/mL), indicating it is the most effective. LPAE has the highest IC50 (255 µg/mL), suggesting it is the least effective among the tested substances. p-value is 0.4036 which is greater than 0.05, there is no statistically significant difference between the antioxidant activities of BHT and the extracts in this case. Graphs and statistical analysis were generated using GraphPad Prism version 8.2, The data is provided in Table 9.
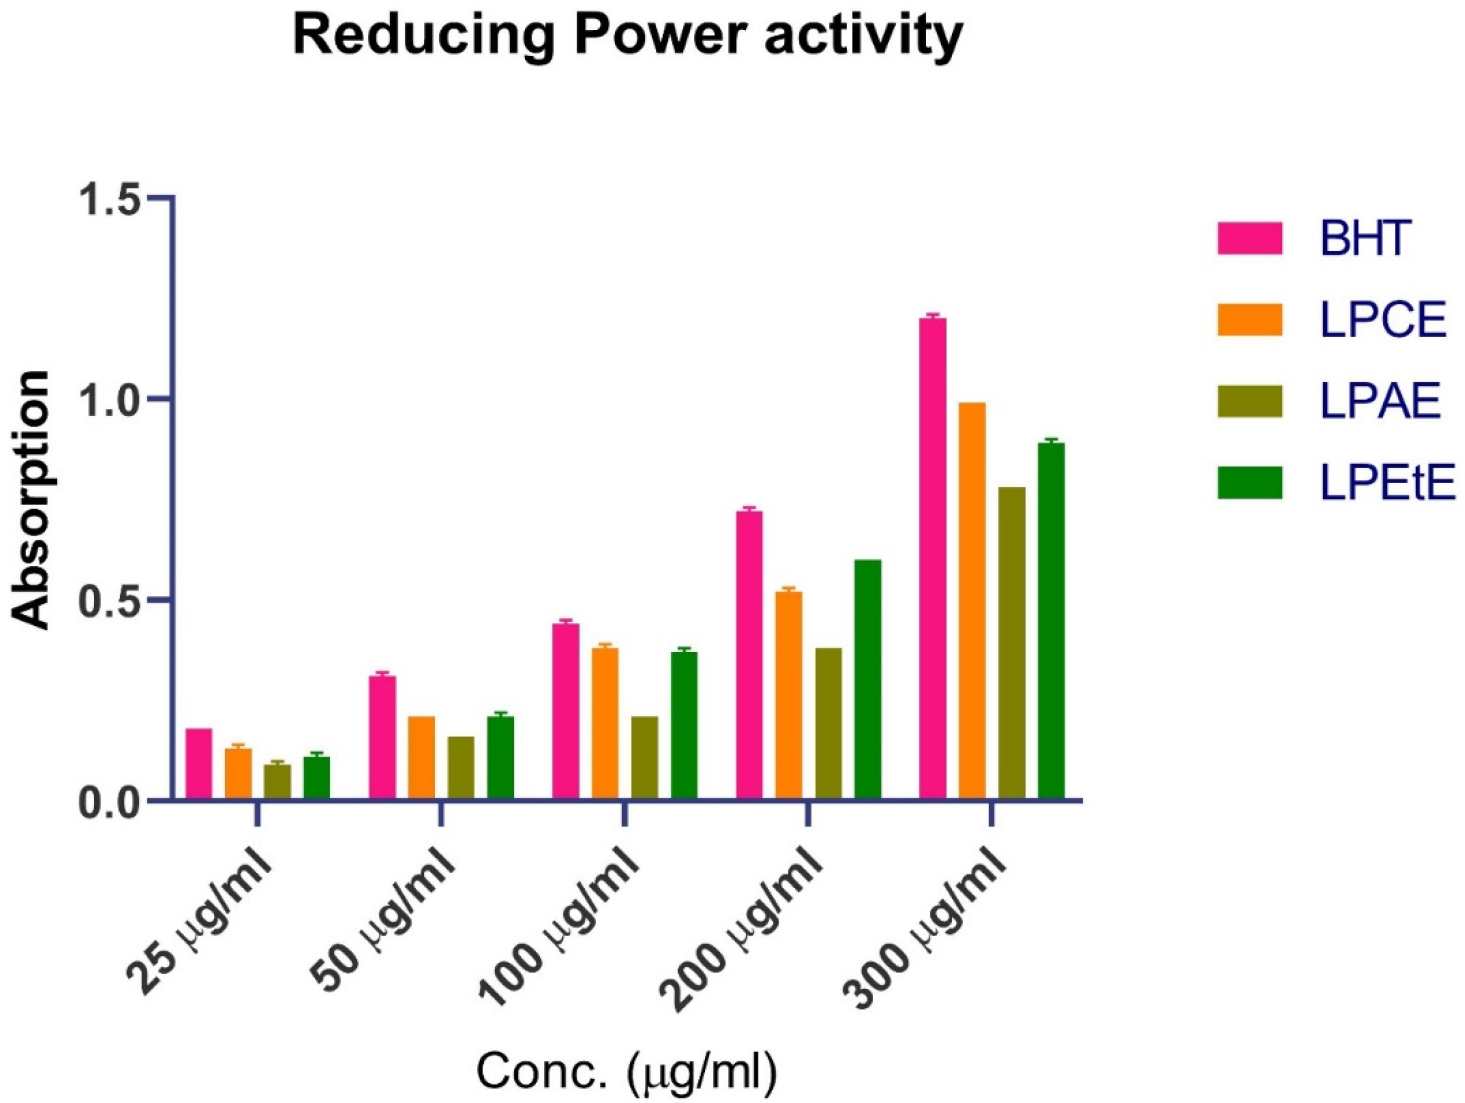
Figure 8:
Reducing power activity of various extracts.
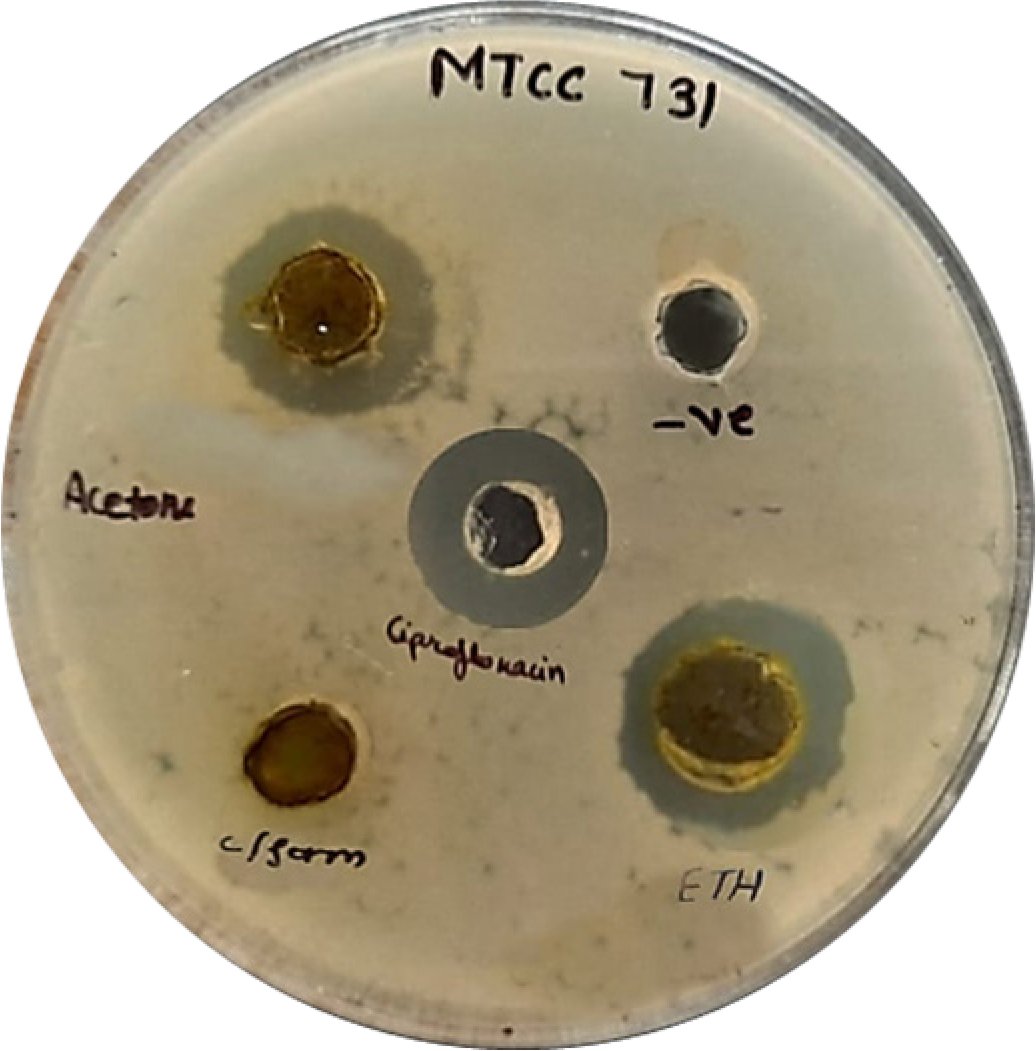
Figure 9:
Zone of Inhibitions of extracts against E. coli (Gram negative bacteria).
Antibacterial activity
All three extracts were tested for zone of inhibition via disk diffusion method against ciprofloxacin as positive control. Findings are documented in the Table 10, Figures 9 and 10 shows the zone of inhibition tested on gram-negative (E. coli) and gram-positive (Bacillus cereus) bacteria. Stains were obtained from DNA lab Dehradun (Uttarakhand) India. The ethanol extract exhibited promising antibacterial activity, effective against both E. coli and Bacillus cereus. The acetone extract was effective against E. coli but inactive against Bacillus cereus. The chloroform extract showed selective activity, being effective only against Bacillus cereus. Although the results were promising but, this study has limitations and we recommend future MIC-based investigations as well.
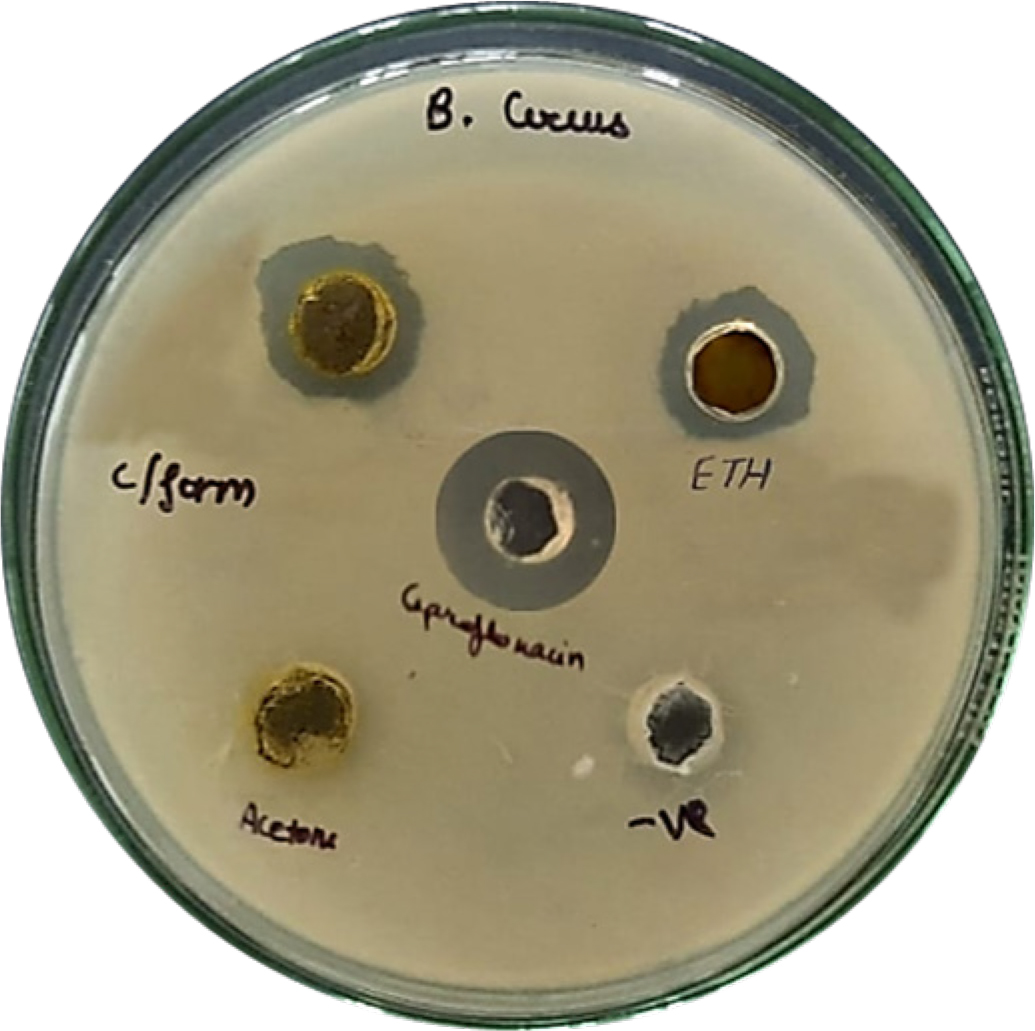
Figure 10:
Zone of Inhibitions of extracts against B. cereus (Gram Positive bacteria).
| Z.O.I. (in mm) for MTCC 731 (E. coli) | Z.O.I. (in mm) MTCC 9411 (Bacillus cereus) | |
|---|---|---|
| LPAE | 18 | 0 |
| LPEtE | 19 | 10 |
| LPCE | 0 | 11 |
| Positive Control (Ciprofloxacin) | 20 | 20 |
| Negative Control | 0 | 0 |
DISCUSSION
Ludwigia palustris is an underutilized semi-aquatic weed that was exposed to intensive pharmacognostic and phytochemical analysis to assess its potential medicinal value. Morphoanatomical investigations unveiled characteristic structural adjustments such as the development of extensive aerenchyma and the unique arrangement of tissues that match its aquatic environment. The occurrence of anomocytic stomata and unicellular trichomes also validate the taxonomic and ecologic suitability of the species.
Physicochemical evaluations established the primary quality control criteria. The water-soluble ash, acid-insoluble ash, and total ash values were within expected limits. The plant did not contain saponins and mucilage, as indicated by the negative tests of the foaming and swelling index and by confirmatory phytochemical screens. The samples had negligible foreign organic matter when cultivated under controlled conditions. The crude fiber value was 6.6%, and elemental analysis revealed the presence of essential minerals such as iron, magnesium, potassium, aluminium, and sulphates. The lack of heavy metals, in addition to its mineral quality and palatability, provides promise for its development as a nutraceutical.
Sequential extraction with Soxhlet apparatus confirmed that ethanol (90%) gave the highest value of extractives (16%), followed by diethyl ether, acetone, and chloroform, with chloroform giving the lowest (3.1%). Phytochemical screening of the extracts revealed flavonoids and phenolic compounds in various solvents, with TLC profiles confirming these. TLC screening with optimized solvent systems showed high band heterogeneity, especially with chloroform and acetone extracts. For flavonoids, Ethyl acetate: Water: Formic acid (80:10:10) and Chloroform: Acetone: Formic acid (60:30:10) solvent systems showed six bands, indicating the occurrence of at least six flavonoid components. For phenolics and chalcones, Toluene: Ethyl acetate (60:40) and Toluene: Acetone (70:30) systems showed 13 and 10 bands, respectively, with the maximum number of bands shown by the chloroform extract.
Quantitative estimation of phytochemical content on a quantitative level revealed that the chloroform extract contained the most total phenolics (404.02±1.51 mg GAE/g), followed by acetone and ethanol extracts. Flavonoid content was also highest in chloroform (154.53±0.67 mg QE/g) and acetone extracts. The content of tannins also paralleled the same trend and had the highest content in the chloroform extract (316.90±8.25 mg TAE/g). These values were in line with the TLC profiles and were well correlated with the antioxidant activity data.
Antioxidant testing proved that the chloroform fraction contained the strongest free radical scavenging activity in the DPPH and hydrogen peroxide models with promising IC50 values. Despite reduced phenolic and flavonoid composition, the ethanolic extract showed high antioxidant activity in hydrogen peroxide scavenging activity and reducing power. This indicates the occurrence of certain, very active antioxidant compounds in the ethanol extract that are not necessarily present in quantity but are highly active.
Notably, the ethanolic extract also showed the greatest antibacterial activity, with a 19 mm inhibition zone against Escherichia coli, almost comparable to the control ciprofloxacin (20 mm). There was moderate activity against Bacillus cereus (10 mm). The chloroform extract, by contrast, demonstrated narrow-spectrum antibacterial activity, with activity confined to Gram-positive bacteria (11 mm inhibition zone against B. cereus), and implies selectivity of its antibacterial compounds.
CONCLUSION
The results of this research identified Ludwigia palustris as a good candidate for future pharmacological and phytochemical investigations. Although the ethanol extract contains relatively fewer phenolic and flavonoid compounds, it had strong antibacterial and antioxidant activities, suggesting the existence of highly active bioactive compounds in low concentrations. In contrast, the chloroform extract has a rich phytochemical content and high antioxidant capacity.
These initial findings highlight the therapeutic potential of L. palustris, especially for antibacterial and antioxidant uses. Future work must revolve around the bioassay-directed isolation, purification, and structural characterization of the active constituents of the extracts with particular interest in finding new compounds with therapeutic values. Further in vivo pharmacological tests and toxicity analysis are also necessary to establish the safety and efficacy of these extracts for therapeutic purposes.
Cite this article:
Rathi VK, Sikarwar MS, Shukla PK. A Comprehensive Study on Ludwigia palustris (L.) Elliott: Physicochemical Characterization, Phytochemical Screening, and Evaluation of Antioxidant and Antibacterial Activities. J Young Pharm. 2025;17(3):559-70.
ABBREVIATIONS
| TLC | Thin Layer Chromatography |
|---|---|
| UV | Ultra-violet |
| LPEE | Ludwigia palustris Ether Extract |
| LPCE | Ludwigia palustris Chloroform Extract |
| LPEAE | Ludwigia palustris ethyl Acetate Extract |
| LPAE | Ludwigia palustris Acetone Extract |
| LPEtE | Ludwigia palustris Ethanol Extract |
| Rf Value | Retention Factor Value |
| IC50 | Inhibitory Concentration |
| BHT | Butylated hydroxy Toluene |
| H2O2 | Hydrogen Peroxide. |
References
- AOAC. (1982) Fiber (crude) in animal feed and pet food. AOAC official method 962.09 Google Scholar
- Aquaplant.edu. (2018) Google Scholar
- Chanda S., Dave R.. (2009)
In vitro models for antioxidant activity evaluation and some medicinal plants possessing antioxidant properties: An overview. African Journal of Microbiology Research 3: 981-996 Google Scholar - Chandran K. C., Kavitha Chandran C. C.. (2016) Quantitative estimation of total phenolic, flavonoids, tannin and chlorophyll content of leaves of (Neelakurinji). ~ 282 ~. Journal of Medicinal Plants Studies 4: 282-286 Google Scholar
- Chinemerem Nwobodo D., Ugwu M. C., Oliseloke Anie C., Al-Ouqaili M. T. S., Chinedu Ikem J., Victor Chigozie U., Saki M., et al. (2022) Antibiotic resistance: The challenges and some emerging strategies for tackling a global menace. Journal of Clinical Laboratory Analysis 36: Article e24655 https://doi.org/10.1002/JCLA.24655 | Google Scholar
- Coffey T.. (1993) The history and folklore of North American wildflowers. https://doi.org/10.1002/JCLA.24655 | Google Scholar
- Egon S.. (2005) Thin layer chromatography: A laboratory handbook https://doi.org/10.1002/JCLA.24655 | Google Scholar
- Harbourne J. B.. (1998) Phytochemical methods: A guide to modern techniques of plant analysis https://doi.org/10.1002/JCLA.24655 | Google Scholar
- Khandelwal K. R.. (2003) Practical pharmacognosy techniques and experiments https://doi.org/10.1002/JCLA.24655 | Google Scholar
- Khandelwal K. R.. (2008) Practical pharmacognosy: Techniques and experiments https://doi.org/10.1002/JCLA.24655 | Google Scholar
- Liyana-Pathirana C. M., Shahidi F.. (2005) Antioxidant activity of commercial soft and hard wheat ( L.) as affected by gastric pH conditions. Journal of Agricultural and Food Chemistry 53: 2433-2440 https://doi.org/10.1021/jf049320i | Google Scholar
- Mangao A. M., Arreola S. L. B., San Gabriel E. V., Salamanez K. C.. (2020) Aqueous extract from leaves of (G. Don) Exell as potential bioherbicide. Journal of the Science of Food and Agriculture. EV 100: 1185-1194 https://doi.org/10.1002/JSFA.10128 | Google Scholar
- Monika W.-H., Joseph S., Teresa K.. (2008) Thin layer chromatography in phytochemistry https://doi.org/10.1002/JSFA.10128 | Google Scholar
- Negi B. S., Dave B. P., Agarwal Y. K.. (2012) Evaluation of antimicrobial activity of Leaves under conditions. Indian Journal of Microbiology 52: 360-365 https://doi.org/10.1007/S12088-012-0264-0 | Google Scholar
- Noreen H., Semmar N., Farman M., McCullagh J. S. O.. (2017) Measurement of total phenolic content and antioxidant activity of aerial parts of medicinal plant . Asian Pacific Journal of Tropical Medicine 10: 792-801 https://doi.org/10.1016/J.APJTM.2017.07.024 | Google Scholar
- Plants.ces. (2018) Plants. https://doi.org/10.1016/J.APJTM.2017.07.024 | Google Scholar
- Quality control methods for medicinal plant materials. (1998) https://doi.org/10.1016/J.APJTM.2017.07.024 | Google Scholar
- Rojas-Sandoval J.. (2020)
Ludwigia palustris (marsh seedbox). CABI compendium. https://doi.org/10.1079/CABICOMPENDIUM.120287 | Google Scholar - Shawky E., Elgindi M., Hassan M.. (2023) Phytochemical and biological diversity of genus : A comprehensive review. ERU Research Journal https://doi.org/10.21608/erurj.2023.210583.1024 | Google Scholar
- Shilpi J. A., Gray A. I., Seidel V.. (2010) Chemical constituents from . Biochemical Systematics and Ecology 38: 106-109 https://doi.org/10.1016/J.BSE.2009.12.014 | Google Scholar
- Yan J., Yang X.-W.. (2005) Studies on the chemical constituents in herb of . Zhongguo Zhong Yao Za Zhi 30: 1923-1926 https://doi.org/10.1016/J.BSE.2009.12.014 | Google Scholar
