ABSTRACT
Objectives: In this study, a new brisk, efficient and precise method of first derivative UV spectrophotometric was developed and validated for the estimation of eugenol and scopoletin simultaneously from the in-house Avipattikar churna. Materials and Methods: The method involved estimation of eugenol and scopoletin by simultaneous equation of first derivative spectra at 296 nm and 278.66 nm respectively in 0.1 N HCl. As per the Beer-Lambert law, proportional absorbance (linearity) was recorded in the concentration limit of 20-100μg/mL for both eugenol and scopoletin. Results: The method validation was done in reference to ICH (International council for harmonisation of technical requirements for pharmaceuticals for human use) norms comprising of accuracy, linearity, precision, the limit of detection, and quantification of standard from churna. This method was found to be precise as % relative standard deviation was less than 2%. The mean recoveries of triplicate samples were found in the range of 98.52 – 101.30% and 100.51 – 100.56 % for eugenol and scopoletin respectively. The limit of detection and limit of quantification were found to be 2.62μg/mL and 7.96μg/mL for eugenol respectively. The limit of detection and limit of quantification were found to be 1.54μg/mL 4.66μg/mL for scopoletin respectively. Conclusion: The developed estimation method was found to be specific, rapid, precise, and accurate for the analysis of eugenol and scopoletin in the Ayurvedic churna and in formulation without showing any interference.
INTRODUCTION
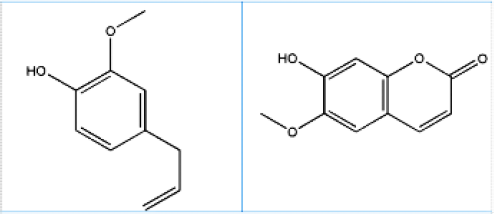
“Avipattikar churna” is an Ayurvedic medicine containing multiple botanical herbs known to reduce hyperacidity thereby making it an effective choice of treatment for acidity and complications associated with it like indigestion, headache, nausea, constipation, piles, and vomiting and peptic ulcers. Ulcer occurs because of improper digestion of food as cited by ayurvedic physicians unanimously.1,2 According to Ayurveda, Avipattikar churna is a dynamic Ayurvedic churna of herbs that aids in strengthening Agni (digestive fire) without aggravating pitta. This distinctive characteristic eliminates heatiness from the intestines and thereby provides effective remedy for spicy food. It is also recommended as a laxative, in piles and helps to increase appetite. Avipattikar churna was prepared in accordance to the Ayurvedic formulary of India.3 Churna mainly contains 14 ingredients. Out of the 14 ingredients, Clove and Jalap are the major ingredients which contain eugenol and scopoletin as active constituents respectively. As per the specified ratio in formulary, Clove (Eugenia caryophyllus) is in 11 parts and Jalap (Ipomoea turpethum) is present in 44 parts of the total 132 parts of the formulation. Clove mainly contains 18% of essential oil. Out of 18%, 89% of the essential oil is eugenol (Figure 1), a phenolic compound, and is eugenol acetate (5 -15%), α-humulen (2.1%), β-cariofileno.4 Other volatile compounds present in lower concentrations are limonene, β-pinene, benzaldehyde, farnesol, ethyl hexanoate and 2-heptanone. In dental treatment, eugenol is most accepted as an anaesthetic and analgesic, also having cardiovascular, anti-inflammatory and antioxidant effects. Eugenol is known to have significant penetration enhancement characteristic and promising candidate for versatile applications.5,6

Figure 1.
Structure of eugenol and scopoletin.
Jalap majorly contains α- and β-turpethein, resin, turpethinic acids A, B, C, D, and E, coumarin like scopoletin (Figure 1), β-sitosterol, betulin, lupeol, cycloartenol, lanosta-5-ene, etc like chemical constituents.7 Discrimination between the root of I. turpethum from the root of its adulterant Marsdenia tenacissima (White nisoth) can be done by estimating the coumarin compound scopoletin (6-methoxy-7-hydroxycoumarin). Scopoletin exhibits varied pharmacological actions such as anti-inflammatory, anti-microbial, antioxidant and even showcases vital role in management of esophagitis, neurological disorders and gastric ulcer.8
The current experimental study is done for establishing a precise, linear, convenient, stable, rapid, validated, and economic UV-spectroscopic method for quantification of eugenol along with scopoletin within a churna which can be further employed for the estimation of phytoconstituents from the various dosage form of Avipattikar churna.
MATERIALS AND METHODS
Reagents and Chemicals
Methanol of Analytical grade was obtained from Merck, India. Eugenol and scopoletin were procured from Yucca Enterprises, Mumbai
Instruments and apparatus
Double-beamShimadzu-ultraviolet(UV)1800spectrophotometer was used for the specrophotometric measurements with matched quartz cells 1cm, and UV probe 2.61 software was used for all spectral measurements.
Preparation of Avipattikar churna (In-house)
As per the procedure outlined in the Ayurvedic formulary of India, in house preparation of churna was done. All the ingredients viz., Terminalia chebula, Zingiber officinale, Piper nigrum, Piper longum, Terminalia bellerica, Embelica officinalis, Cyperusrotundus, Vida lavana (salt), Embelia ribes, Elettaria cardamomum, Syzgium aromaticum, Cinnamomum tamala, Ipomoea turpethum, and Saccharum officinarum were individually grinded, sieved through 80# screen and then blended in proportions as specified in Ayurvedic formulary of India.
Preparation of standard solutions
10 mg of eugenol and scopoletin standards were weighed and dissolved into volumetric flask (100 mL) containing 10mL methanol. Further the dilutions were made with 0.1 N HCl to get a working standard solution containing a 100μg/ml concentration of eugenol and scopoletin respectively.
Methods
UV spectrophotometer with the range of 200-400 nm was used to scan the prepared standard solutions of eugenol (20 μg/mL) and scopoletin (20μg/mL). 0.1 N HCl was used as blank solution in order to obtain the zero-order spectra and first-derivative spectra with 10nm inter-point distance. Triplicate spectrums were recorded. The zero-crossing point (ZCPs) for eugenol and scopoletin were recorded and confirmed by using different concentration of the selected markers.
Calibration curves
Total 2 sets of eugenol and scopoletin (100µg/mL) standard solutions were prepared and diluted further to obtain series A and B solutions.
Series A: In 10 mL of volumetric flask eugenol solutions (2, 4, 6, 8, 10mL) were pipette out to obtain the range of 20-100 µg/mL. Further the dilutions were made up with 0.1 N HCl.
Series B: In 10 mL of volumetric flask scopoletin solutions (2, 4, 6, 8, 10mL) were pipette out to obtain the range of 20-100 µg/mL. Further the dilutions were made up with 0.1 N HCl.
Sample preparation of in house Avipattikar churna
Accurately weighted 100 mg of Avipattikar churna was extracted by using methanol (10 mL). The obtained mixture further diluted up to 100 mL by using 0.1 N HCl which is followed by reflux for one hour. The obtained extract was filtered by whatman filter paper No.41 and again diluted with 100 mL 0.1 N HCl. The final resulting solution further subjected to UV analytical method.
RESULTS
In this research study we have developed an accurate, rapid and precise UV derivative spectrophotometry method for the simultaneous estimation of eugenol and scopoletin in In-house Avipattikar churna. Further method validation was performed by quantitative parameters like accuracy, precision, stability LOD, and LOQ.
Derivative spectrophotometric method development
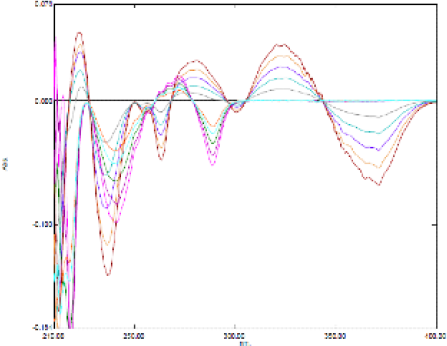
The zero-order absorption spectra for eugenol and scopoletin solutions in 0.1 N HCl is observed in an overlapping mode in defined 200-400 nm UV range. It is very difficult to quantify eugenol in existence of scopoletin by zero-order UV spectrophotometric method. In order obtain results; derivative spectrophotometry method was performed for the quantification of both the markers. This method will remove broadband contributions as well as it would overcome the interference from peak overlapping. The zero-order spectra were transformed into first-order derivative spectra and then overlapping of both zero-order spectra was done to find out zero crossing point. 296 nm and 278.66 were selected as the zero-crossing point (ZCP) for scopoletin and eugenol respectively (Table 1). 296nm was chosen for the quantification of eugenol (where derivative response of scopoletin was 0). In the same way, 278.66 nm was chosen for estimation of scopoletin (where derivative response of eugenol was 0).
| Drugs | Zero crossing point (nm) | Detection wavelength (nm) |
|---|---|---|
| Eugenol | 278.66 | 296 |
| Scopoletin | 296 | 278.66 |
These identical wavelengths have been confirmed from the overlain spectra of different concentrations of scopoletin with a single concentration of eugenol. Derivative spectra of the first order (Figure 2) were investigated for both eugenol and scopoletin individually and simultaneously, giving results with suitable precision. The overlapped spectra of eugenol and scopoletin were recorded by first-order derivative spectroscopic method (Figure 3).

Figure 2.
Overlay spectra of Single eugenol concentration with scopoletin

Figure 3.
Derivative spectroscopy of eugenol and scopoletin.
Method Validation
Linearity, range, Repeatability, Precision, Accuracy and sensitivity parameters were used for the validation of simultaneous estimation of eugenol and scopoletin in developed method.
Linearity and range
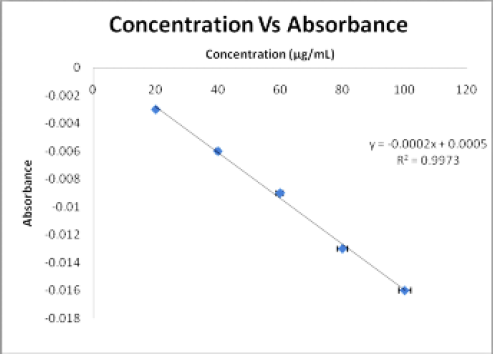
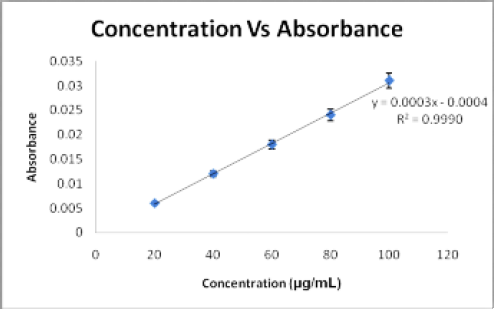
The calibration curve of eugenol and scopoletin were showed linear regression with a good linear relationship in the range of 20-100 μg/mL concentration. The calibration curve of eugenol and scopoletin are shown in Figures 4 and Figure 5. Linear regression equations and correlation coefficient (r2) values for eugenol and scopoletin have represented in Table 2.

Figure 4.
Calibration curve of eugenol at 296 nm.

Figure 5.
Calibration curve of scopoletin at 278.66nm.
| Parameters | Eugenol | Scopoletin |
|---|---|---|
| Absorbance | 296nm | 278.66nm |
| Linear range | 20-100 μg/mL | 20-100 μg/mL |
| Regression equation | Y= -0.0002X + 0.0005 | Y= 0.0003X-0.0004 |
| Slope | -0.0002 | 0.0003 |
| Intercept | 0.0005 | 0.0004 |
| Correlation coefficient | 0.9973 | 0.9990 |
Precision
The intraday and interday precisions were discovered by quantifying the consequent responses with thrice in a same day and over a period of 1 week six different days by using 3 individual concentrations of 20, 40, and 60 µg/mL eugenol and scopoletin. The %RSD values for intraday ranged from 0.61 to 1.88% and from 0.61 to 1.87% for eugenol and scopoletin, respectively (Table 3). The %RSD values for interday ranged from 1.27 to 1.84% and from 0.80 to 1.90% for eugenol and scopoletin, respectively (Table 3).
| Intraday Precisions: | ||||
|---|---|---|---|---|
| Drug | Concentration (µg/mL) | Mean (n=3) | SD | % RSD |
| Eugenol | 20 | -0.00313 | 5.77E-05 | 1.84261 |
| 40 | -0.00613 | 0.000115 | 1.88266 | |
| 60 | -0.00943 | 5.77E-05 | 0.61203 | |
| Scopoletin | 20 | 0.006167 | 0.000115 | 1.872487 |
| 40 | 0.012233 | 0.000208 | 1.701634 | |
| 60 | 0.018667 | 0.000115 | 0.61859 | |
| Interday Precisions: | ||||
| Drug | Concentration (µg/mL) | Mean (n=3) | SD | % RSD |
| Eugenol | 20 | -0.00313 | 5.77E-05 | 1.84261 |
| 40 | -0.00607 | 0.000115 | 1.90335 | |
| 60 | -0.00907 | 0.000115 | 1.27357 | |
| Scopoletin | 20 | 0.006067 | 0.000115 | 1.903353 |
| 40 | 0.0124 | 0.0001 | 0.806452 | |
| 60 | 0.018367 | 0.000321 | 1.750209 | |
Repeatability
Relative standard deviation (%RSD) for repeatability was found to be 1.70% and 0.88% for eugenol and scopoletin respectively. % RSD value was found to be less than 2, represented in Table 4.
| Parameters | Eugenol | Scopoletin |
|---|---|---|
| Intraday Precision (%RSD, n=3) | 1.44 | 1.39 |
| Interday Precision (%RSD, n=3) | 1.67 | 1.48 |
| Repeatability (%RSD, n=3) | 1.70 | 0.88 |
| Accuracy (% Recovery, n=3) | 100.92% | 100.26% |
| LOD (µg/mL) | 2.62 | 1.54 |
| LOQ (µg/mL) | 7.96 | 4.66 |
Accuracy
Accuracy is the closeness of a measured value to the actual value. The accuracy was determined through calculating recoveries for eugenol and scopoletin with the help of standard addition method. The mean recoveries of triplicate samples were found in the range of 98.52 – 101.30% and 100.51 – 100.56 % for eugenol and scopoletin respectively.
Sensitivity
The LOD was found to be 2.62μg/mL and 1.54μg/mL for eugenol and scopoletin individually. The LOQ was found to be 7.96μg/mL for eugenol and 4.66μg/mL for scopoletin (Table 4).
DISCUSSION
To ensure consistent quality of Ayurvedic churna, its active constituents’ standardization is inevitable. Herbal ingredients harvested from different geography, climatic conditions, etc. may differ in quality and quantity of their active constituents, thereby give varying therapeutic results.9 To maintain the therapeutic efficacy of herbal ingredients it is necessary to standardize them by qualitative and quantitative parameters; by estimating the active markers in raw material we can check the efficacy and therapeutic effect of the drug. So for estimating the active markers various analytical methods have been established and validated. Avipattikar churna a well-known peptic ulcer remedy should be quantified by analytical methods for producing its efficacy.
Avipattikar churna is composed of 14 different ingredients. Out of these, 12 are active ingredients and other two are sugar and salt. All 14 ingredients contain different actives. Except Eugenia caryophyllus (clove) and Ipomoea turpethum (Jalap), other ingredient proportions are very less as per the formula given in Ayurvedic formulary. Avipattikar churna was standardized by its qualitative parameters. The authors has reported presence of gallic acid as a qualitative marker by HPTLC method and performed stability studies of formulation for 45 days to check the presence of eugenol in sample by HPLC studies by comparing the peak areas.10 Moreover, in different ingredients of churna and in composite churna a rapid, sensitive UV spectroscopic method was developed by using gallic acid as marker at 271nm and validated by different parameters as mentioned in ICH.11 Furthermore, the other literature review revealed that there are various methods available for the detection and quantification of eugenol alone or along with other constituents using UV-spectroscopy,12 High-performance liquid chromatography13 and LC-MS.14 Likewise, scopoletin was estimated by UV-spectroscopy,15 HPTLC16 and High-performance liquid chromatography.17 Hence, from the literature review it is clear that there is no method reported in pharmacopoeias for simultaneous analysis of eugenol and scopoletin by UV spectroscopy in Avipattikar churna.
UV spectroscopic method development and validation was performed for simultaneous estimation for eugenol and scopoletin because their absorption spectra overlie each other making it difficult to determine by zero order spectroscopy. By applying first order derivative zero crossing spectroscopic method both eugenol and scopoletin were precisely measurable at each others’ zero crossing point without any meddling. Scopoletin was quantified at 278.66nm (i.e., ZCP of eugenol) and eugenol was determined at 296nm (i.e., ZCP of scopoletin). Thus, by following first order derivative approach, the specificity and resolution of UV spectroscopic estimation method improved.18
As per ICH guidelines19 the method validation was done by performing various parameters like accuracy, linearity, precision, intraday, interday and range. To check reproducibility, recovery studies were also carried out. All the validation parameters represented in Table 4 and are found within range, relative standard deviation is also observed below 2 for all the validation parameters. The percentage recovery was 100.92% and 100.26% for eugenol and scopoletin respectively. The regression equations of the both standards of eugenol and scopoletin showed 0.9973 and 0.999 correlation coefficients (R2) which indicated appropriate proportionality of absorbance with the concentrations.20
Thus, this method can be used to estimate eugenol and scopoletin from the different formulations of the Avipattikar churna. As depicted by regression analysis in-house Avipattikar churna contained 0.12%w/w and 0.0389%w/w of eugenol and scopoletin respectively (Table 5). So the developed method was found to be simple, rapid and sensitive for the estimation of the active ingredients.
| Ayurvedic formulation | % Eugenol | % Scopoletin |
|---|---|---|
| In-house Avipattikar Churna | 0.12 % (w/w) | 0.0389 % (w/w) |
CONCLUSION
In this research work, we have developed simple and reproducible simultaneous method for the quantification of eugenol and scopoletin in Avipattikar churna by first derivative UV spectroscopic method and validated as per ICH guidelines. The proposed method is accurate, economical and effective for the quantification of eugenol and scopoletin which can be further used for the analysis of the developed formulation of Avipattikar churna.
References
- . Formulary of Ayurvedic medicine. 2nd ed. [Google Scholar]
- Zaveri M, Patel V. Gastroprotective effects of Polyherbal Ayurvedic Formulation: an . Am J PharmTech Res. 2011;1(4):219-31. [Google Scholar]
- Jirovetz L, Buchbauer G, Stoilova I, Stoyanova A, Krastanov A, Schmidt E, et al. Chemical composition and antioxidant properties of clove leaf essential oil. J AgricFood Chem. 2006;54(17):6303-7. [PubMed] | [CrossRef] | [Google Scholar]
- Pramod K, Ansari SH, Ali J. Eugenol: a natural compound with versatile pharmacological actions. Nat Prod Commun. 2010;5(12):1999-2006. [PubMed] | [CrossRef] | [Google Scholar]
- Khalil AA, Rahman Uu, Khan MR, Sahar A, Mehmood T, Khan M, et al. Essential oil eugenol: sources, extraction techniques and nutraceutical perspectives. RSC Adv. 2017;7(52):32669-81. [CrossRef] | [Google Scholar]
- Gupta S, Ved A. Operculina turpethum (Linn.) Silva Manso as a medicinal plant species: a review on bioactive components and pharmacological properties. Pharmacogn Rev. 2017;11(22):158-66. [PubMed] | [CrossRef] | [Google Scholar]
- Mahattanadul S, Ridtitid W, Nima S, Phdoongsombut N, Ratanasuwon P, Kasiwong S, et al. Effects of Morinda citrifolia aqueous fruit extract and its biomarker scopoletin on reflux esophagitis and gastric ulcer in rats. J Ethnopharmacol. 2011;134(2):243-50. [PubMed] | [CrossRef] | [Google Scholar]
- Patil S, Shah S. Preparation, Quality Control and Stability Studies of . J Drug Deliv Ther. 2019;9(3-s):531-6. [PubMed] | [CrossRef] | [Google Scholar]
- Dixit VK, Irchhaiya R, Dudhe R, Singh N. Standardization and quantitative analysis of Avipattikar churn am by UV spectroscopy. Adv Sci Res. 2019;10(04):72-5. [PubMed] | [CrossRef] | [Google Scholar]
- Indalkar YR, Aloorkar NH. Validation of eugenol in ethanol by UV spectrophotometric method. Asian Jour Pharmac Anal. 2015;5(4):178-80. [CrossRef] | [Google Scholar]
- Inam F, Deo SU, Narkhede NE. HPLC–UV method development and quantification of eugenol from methanolic extracts of some spices. Int J Chem Phys Sci. 2014;3(6):92-2. [CrossRef] | [Google Scholar]
- Ye L. Development and validation of a LC-MS/MS method for the determination of isoeugenol in finfish. Food Chem. 2017;228:70-6. [PubMed] | [CrossRef] | [Google Scholar]
- Tan DC, Quek A, Kassim NK, Ismail IS, Lee JJ. Rapid quantification and validation of biomarker scopoletin in Paederia foetida by qNMR and UV–vis for herbal preparation. Molecules. 2020;25(21):5162 25(21) [PubMed] | [CrossRef] | [Google Scholar]
- Modi KP, Pagi KB, Lahiri SK, Shah MB. Development of a validated HPTLC method for quantification of scopoletin in Ipomoea turpethum root and its market formulations. Indian J Nat Prod. 2019;33(1):49-2. [PubMed] | [CrossRef] | [Google Scholar]
- Patel P, Raval M, Patel N, Patel S, Vyas N, Patel A, et al. Quantification of scopoletin from the roots of Argyreia speciosa (Linn. F) Sweet Using HPLC Through the Concept of Design of Experiment. J AOAC Int. 2021;104(4):1167-80. [PubMed] | [CrossRef] | [Google Scholar]
- Acharya SP, Dave H, K Pundarikakshudu P, Lalwani A. Microemulsion for simulataneous intransal delivery of carbamazepine and vitamin B6 for treatment of epilepsy. J Young Pharm. 2021;13(4):375-80. [CrossRef] | [Google Scholar]
- Lotfy HM, Fayez YM, Michael AM, Nessim CK. Simultaneous determination of mebeverine hydrochloride and chlordiazepoxide in their binary mixture using novel univariate spectrophotometric methods via different manipulation pathways. Spectrochimica Acta Part A: Molecular and Biomolecular Spectroscopy. 2016;155:11-20. [CrossRef] | [Google Scholar]
